
Figures & data
Table 1. Patient characteristics and distribution of influenza (sub)types over the 4 consecutive influenza seasons.
Table 2. Symptoms, pneumonia and clinical risk scores on admission, total and by age group.
Table 3. Severe outcomes and associations with patient characteristics, laboratory data, clinical risk scores and antimicrobial treatment.
Figure 1. Symptoms, clinical risk scores and outcomes of disease and according to influenza (sub)types. (a) Percentage of patients self-reporting specific symptoms prior to admission. (b) Percentage of patients with high clinical risk scores on admission defined by CRB, CRB65, SIRS and qSOFA criteria. CRB is a modified CRB65 score, where age of the patients no longer is part of the score. (c) Percentage of patients with various severe outcomes. Oxygen: oxygen supplementation and ICU: intensive care unit. *indicates p<.05 and **indicates p < 0.01 (chi2 analyses).
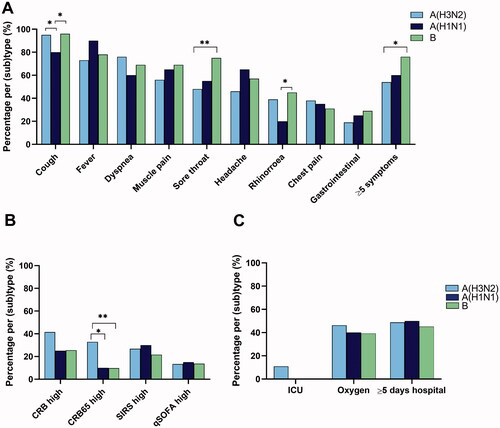
Figure 2. Use of antimicrobial treatment according to influenza season and influenza (sub)types. (a) Percentage of patients receiving antiviral and antibiotic treatment over the four consecutive influenza seasons. For each treatment type, season 1 is compared with the other seasons. (b) Percentage of patients receiving antiviral and antibiotic treatment according to their influenza (sub)types. *indicates p<.05 and **indicates p<.01 (chi2 analyses).
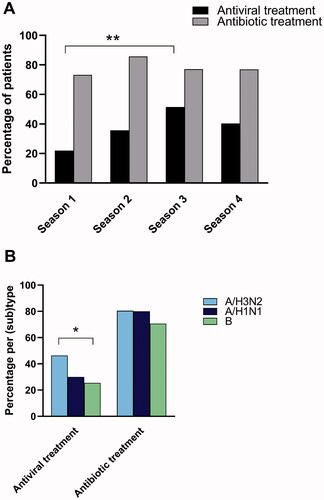
Table 4. Antiviral and antibiotic treatment and associations with patient characteristics, laboratory data and risk scores.