Figures & data
Figure 1. Overview of the inclusion process. After exclusion, 286 patients remained that fulfilled the inclusion criteria and with data available. CT: computed tomography; Ct: cycle threshold.
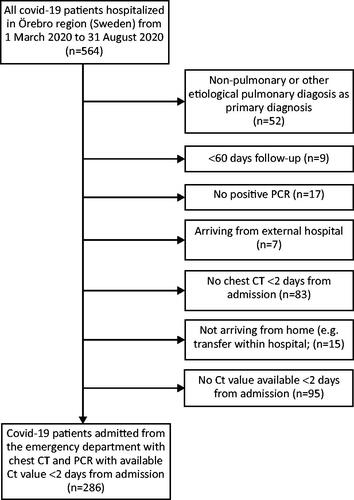
Table 1. Patient characteristics.
Table 2. Association between extracted variables and ICU admission or death.
Figure 2. Relation between degree of lung involvement on chest CT images (x axis) and Ct value at admission (y axis). Boxes show median and interquartile range, whiskers represent range. Abbreviations: CT = computed tomography, Ct = cycle threshold.
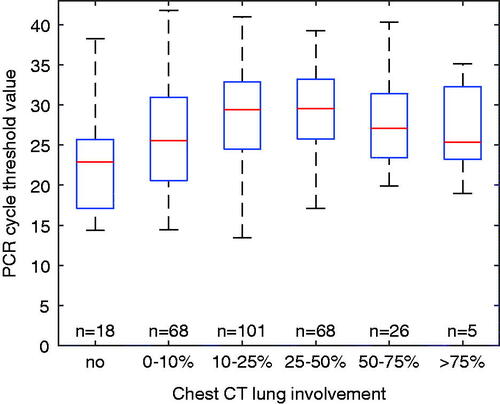
Figure 3. Univariate regressions with proportion of patients reaching the outcome ICU admission or death within 60 days as dependent variable (y axis) and Ct value as independent variable (x axis), for all patients (a) and in groups based on degree of lung involvement (b–d). Regarding b-d, a significant association was demonstrated for <25% (b) and 25–50% (c) but not for >50% (d). Abbreviations: ICU = intensive care unit, Ct = cycle threshold.
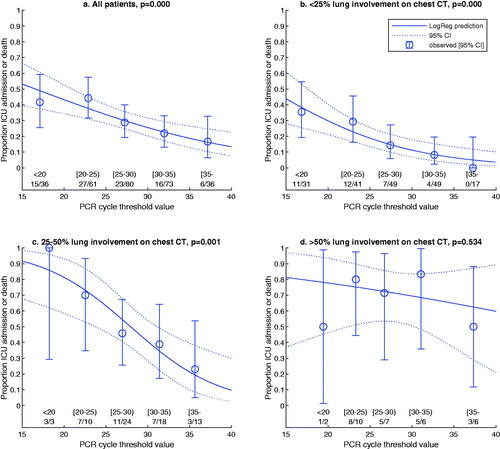
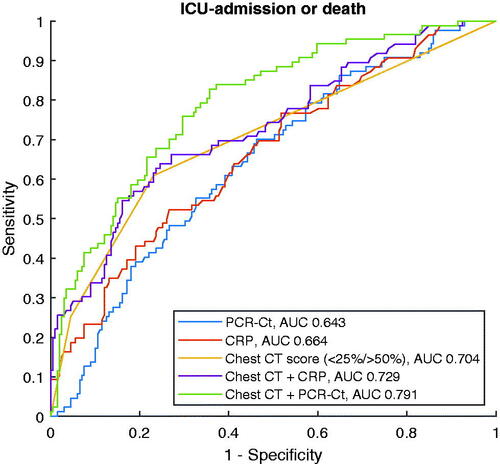
Figure 4. ROC curves for the outcome ICU admission or death 60 days post hospital admission. Explanatory variables are Ct value, CRP, degree of lung involvement in chest CT images or combinations of the latter with either Ct value or CRP. The y axis represents sensitivity and the x axis 1-specificity. ICU: intensive care unit; Ct: cycle threshold; CRP: C-reactive protein; CT: computed tomography.