
Figures & data
Figure 1. Flowchart showing the inclusion process and selection of patients and episodes, and the number of episodes per patient.
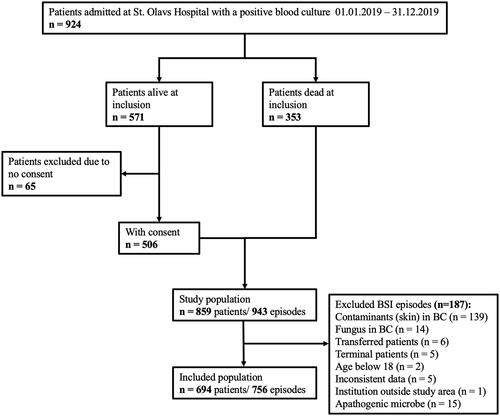
Table 1. Characteristics of 756 episodes of bloodstream infection.
Table 2. Microbe characteristics.
Figure 2. Association between compliance with national clinical practice guideline (NCPG) and concordant empirical antimicrobial therapy. Of the episodes receiving empirical antimicrobial therapy compliant with NCPG, 452 (85.8%) and 75 (14.2%) were concordant and discordant, respectively. Of the episodes receiving empirical antimicrobial therapy not compliant with NCPG, 129 (73.7%) and 46 (26.3%) were concordant and discordant, respectively. Episodes with empirical antimicrobial therapy classified as either partial or uncertain coverage were excluded from the analysis. Asterisk indicates a statistically significant association between compliance with NCPG and concordant empirical antimicrobial therapy (Fisher’s exact test, p = .001).
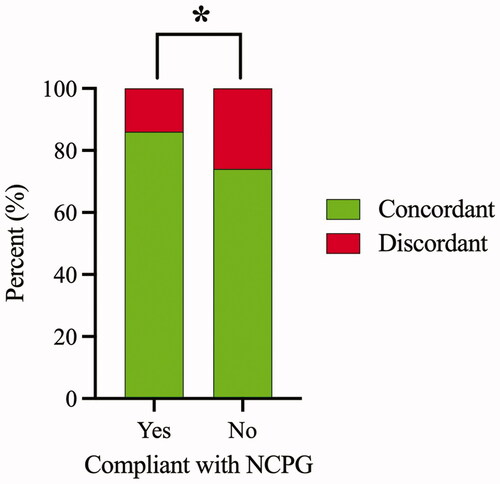
Table 3. Predictors for discordant empirical antimicrobial therapy when compared with causative bacterial species and its susceptibility profile*.
Figure 3. Kaplan-Meier plot showing the cumulative intra-hospital (A) and long-term (B) survival of patients with BSI who received concordant or discordant empirical antimicrobial therapy. BSI episodes with empirical antimicrobial therapy classified as uncertain coverage, partial coverage and no empirical antimicrobial therapy given were excluded from the analysis.
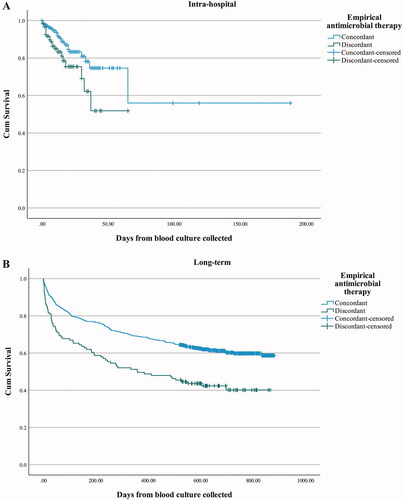
Table 4. Predictors for intra-hospital case fatality rate.
Supplemental Material
Download MS Word (45.2 KB)Data availability statement
The datasets used and/or analysed during the current study are not publicly available due to restrictions from The Regional Committee for Medical and Health Research Ethics, health region mid-Norway (REK midt 210524).