
Figures & data
Table 1. Clinical features of included patients during follow-up.
Scheme 1. Variables that predispose to the development of persistent post-COVID-19 syndrome. (A) The expression of CD57 in CD8+ T cells. (B) Obesity. (C) History of acute-Post-COVID-19 syndrome. (D,E) Increased serum levels of IP-10 and MIP-1α.
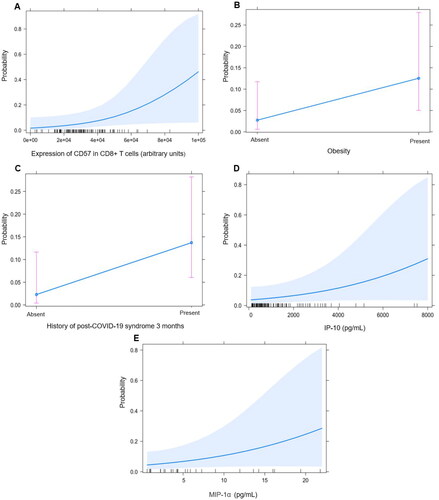
Table 2. Variables associated with persistent PASC at 6 months.
Scheme 2. Statistical Model of persistent post-COVID-19 syndrome. (A) Area under the curve (AUC) with 95% CI using a cut-off point >_12. (B) Calibration plot showing a good capacity of the model for persistent post-COVID-19 syndrome features.
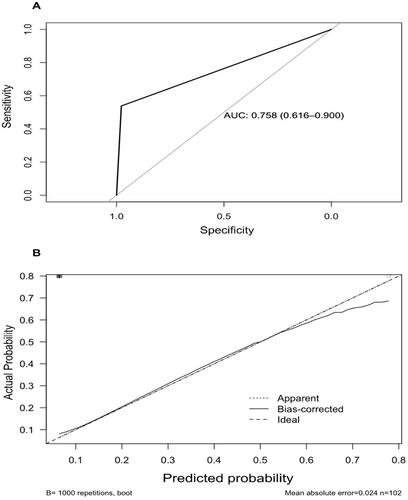
Table 3. Optimism-corrected accuracy parameters of the model.
Supplemental Material
Download MS Word (33.9 KB)Data availablity statement
All data generated or analysed during this study are included in this published article.