Figures & data
Table 1. Demographic and clinical characteristics of patients with E. coli blood stream infections.
Figure 1. Thirty-day survival in ESBL-producing E. coli compared to non-ESBL-producing E. coli blood stream infections.
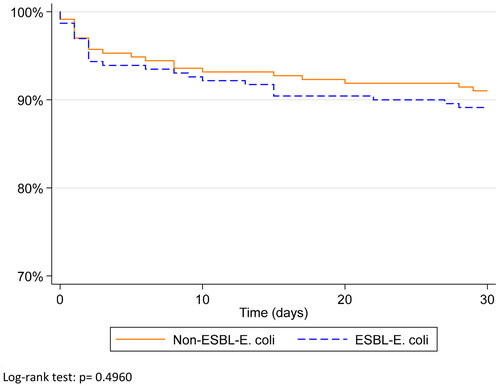
Table 2. All-cause mortality for patients with ESBL-producing E. coli compared to non-ESBL-producing E. coli bloodstream infections.
Figure 2. Time to administration of the first dose of effective antibiotic in ESBL-producing E. coli compared to non-ESBL-producing E. coli blood stream infections.
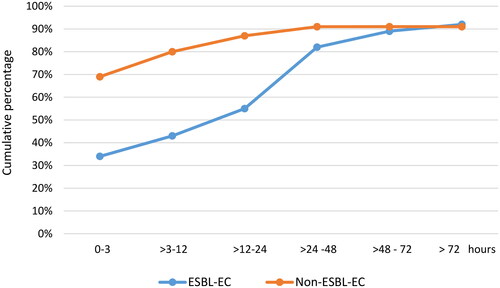
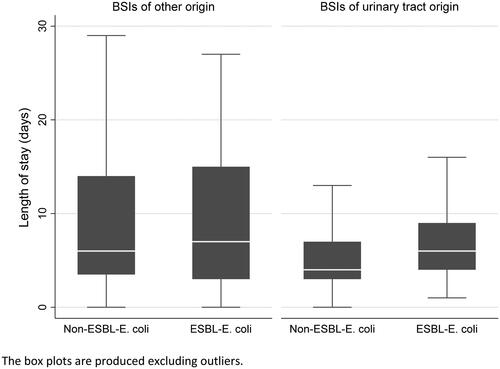
Figure 3. Length of stay of ESBL-producing E. coli compared to non-ESBL-producing E. coli blood stream infections according to source of infection.