
Figures & data
Figure 1. Flow chart over the selection process from original cohorts. HL: hearing loss; DD: developmental delay.
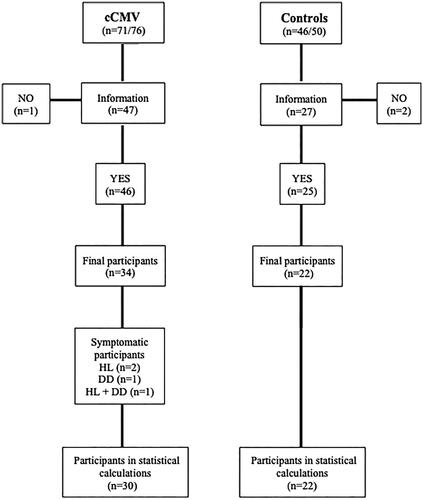
Table 1. Demographics (age, sex, hearing loss and CNS symptoms in childhood).
Figure 2. Boxplot representing median raw scores on FAS letter fluency, respectively, and verb fluency in both groups (cCMV and controls).
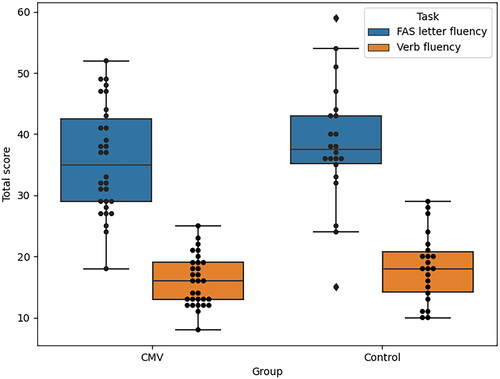
Figure 3. Individual results for SD in asymptomatic participants with cCMV (n = 30) and controls (n = 22) when compared to Swedish norms for verb and FAS letter fluency test results (controlled for sex and education level). SD ≥ 1.5 is atypical.
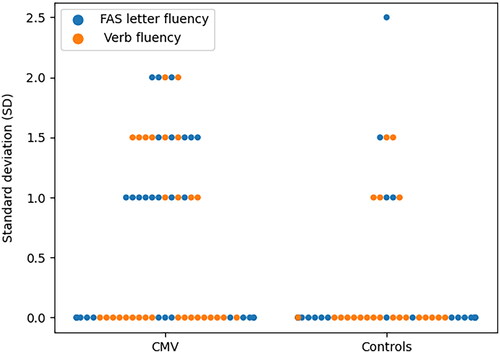
Figure 4. Boxplot and scatterplot representing results on FAS letter tasks for both groups (cCMV vs. Controls).
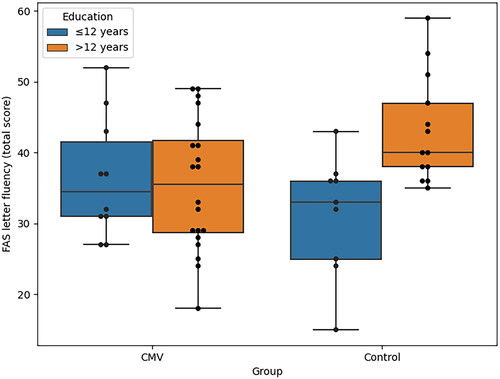
Figure 5. Boxplot and scatterplot representing results on verb fluency tasks for both groups (cCMV vs. Controls).
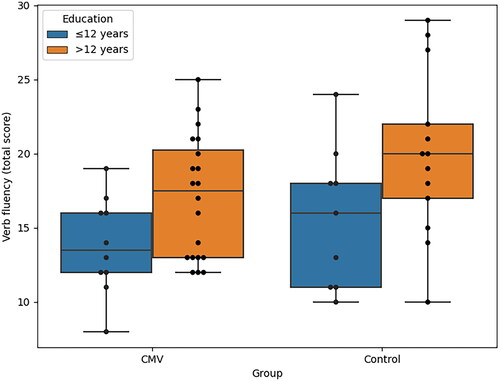
Table 2. Scores on FAS and verb fluency (mean ± SD) in participants without prelingual hearing loss/deafness or intellectual disability (n = 52), divided into subgroups (cCMV vs. Controls with different education levels) and analysed with Mann–Whitney U test.
Table 3. Results for different clustering on FAS letter fluency and verb fluency tasks (mean ± SD; n = 52) divided into subgroups (cCMV vs. Controls with different education levels), and analysed with Mann–Whitney U test.
Appendix 1. Individual results in the cCMV group (n = 34).
Appendix 2. Individual results in the control group (n = 22).