
Figures & data
Table 1. Characteristics of episodes with negative and positive valve culture.
Figure 1. Development of the study population with reasons for exclusions.
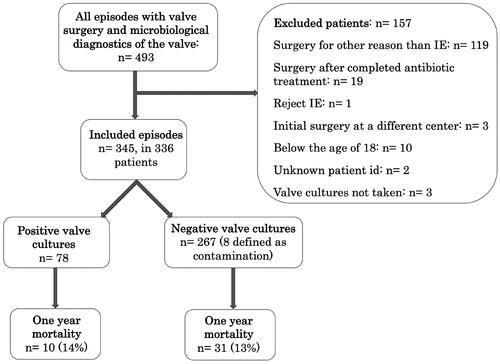
Table 2. Microbiological findings in blood and valve cultures.
Table 3. Episodes with follow-up blood cultures.
Table 4. Multivariable analysis for positive valve cultures.
Figure 2. Kaplan–Meier curves presenting survival in patients with positive and negative valve cultures until one year after surgery.
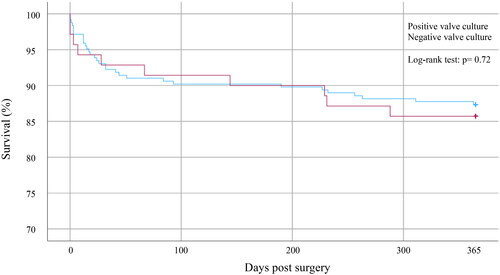
Table 5. Outcomes in episodes with negative and positive valve cultures.
Table 6. Characteristics of patients with one-year mortality and final mortality model.
Appendix 1. Microbiological findings in episodes with valve cultures defined as contaminated.
Appendix 2. Number of PVC in each group of duration of antibiotic treatment.
Appendix 3. Univariable and stepwise forward multivariable logistic regression with duration of preoperative antibiotic treatment as a continuous variable.
Appendix 4. Cases defined as relapses with case description and information about antibiotic treatment.