
Figures & data
Table 1. Sociodemographic and clinical characteristics of 119 Ethiopian tuberculosis patients.
Table 2. Genotype and variant allele frequency of SLCO1B1, ABCB1, AADAC and CES-2.
Table 3. Effects of SLCO1B1, ABCB1, AADAC and CES-2 genotype on rifampicin Cmax and AUC0–7 h in Ethiopian TB patients (n = 119).
Figure 1. Comparison of rifampicin Cmax and AUC0–7 h in the ABCB1 c.4036A > G (right) and AADAC2 c.841G > A (left) genotypes. The box plots show the median ± interquartile range, whereas whiskers denote the minimum and maximum values.
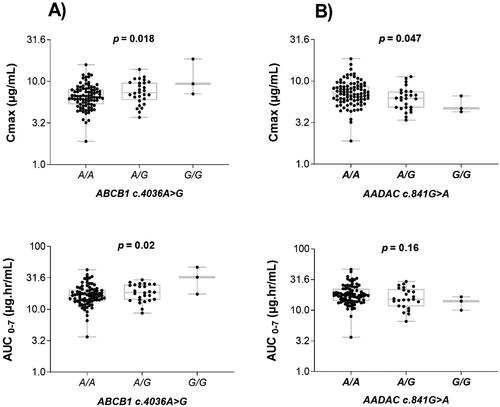
Table 4. Univariate and multivariate linear regression analysis of factors associated with rifampicin log10Cmax and log10AUC0–7 h in Ethiopian adult tuberculosis patients.