0
Views
0
CrossRef citations to date
0
Altmetric
Research Article

Duration from start of antibiotic exposure to onset of Clostridioides difficile infection for different antibiotics in a non-outbreak setting

ORCID Icon, &
Received 17 Apr 2024, Accepted 28 Jun 2024, Published online: 18 Jul 2024

Figures & data

Figure 1. Kaplan-Meyer Curve showing the number of days elapsed from start of antibiotic exposure to CDI. For comparison between curves see below.

Figure 1. Kaplan-Meyer Curve showing the number of days elapsed from start of antibiotic exposure to CDI. For comparison between curves see below.TableDownload CSVDisplay Table

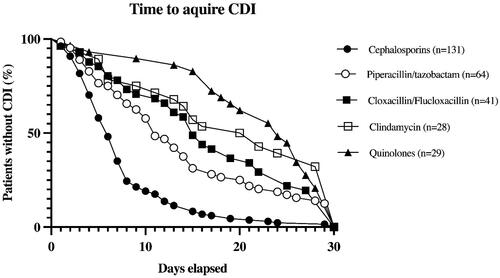
Table 1. Patient characteristics.

Table 2. Days from start of antibiotic exposure to CDI and onset during ongoing antibiotic treatment.

Table 3. Severe CDI.

Data availability statement

Data will be available upon reasonable request to corresponding author.