Figures & data
Figure 1. Graphical summary. Sera samples were extracted from a cohort of convalescent individuals (post-infection) or from a cohort of vaccinated individuals, after the second dose of vaccination (post-vaccination). Immunity levels were measured with commercial antibody assays (ELISA and CLIA) as well as a neutralising antibody assay with pseudovirus particles. Figure includes additions created with biorender.com.
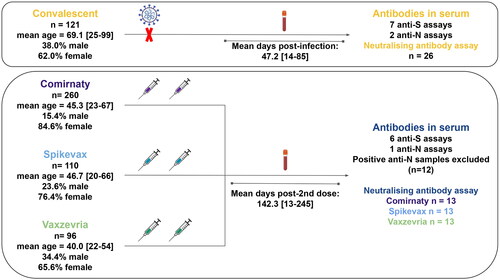
Table 1. List of assays used in this study.
Figure 2. Technique result agreement in sera of convalescent individuals. (A) The ratio of individuals with positive detection of antibodies after infection ranged from 94% (Virclia) to 81% (Euroimmun), with 78% of the samples giving the same qualitative result in all tests. (B) Age was not related with antibody detection (68.4 ± 18.9 vs. 81.2 ± 13.6; p = 0.051, Wilcox rank-sum test) (C) Day of sera sampling had a non-significant impact in the seroconversion results (47.2 ± 16.5 vs. 46.2 ± 5.6; p = 0.71, t-test). In (B and C), in case of discrepancies, negative and positive were defined as the result given by a majority of tests.
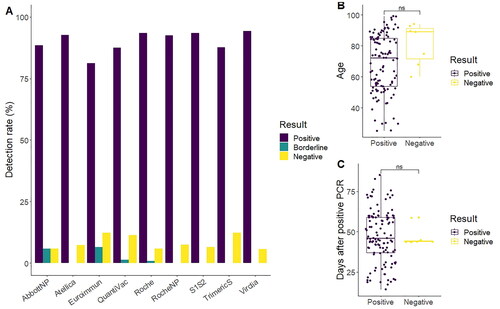
Table 2. Samples with discrepant results across tests.
Figure 3. Boxplot of antibody values all for the tests used targeting anti-spike antibodies in the vaccine cohort. The kits showed discrepancies in the antibody levels depending on the vaccine and test used. S1S2 results were not added to the graph as the S1S2 test does not provide a standardisation value to BAU/ml.
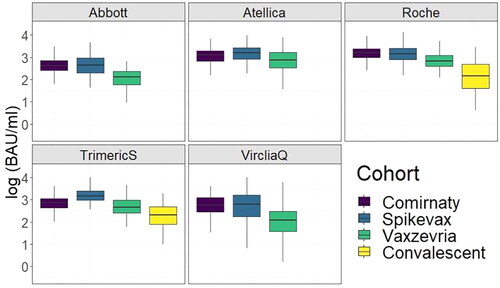
Figure 4. Correlation matrix across techniques expressed as spearman’s correlation coefficient (ρ). (A) Pairwise correlation coefficients for the convalescent cohort. (B) Pairwise correlation coefficients for the vaccine cohort.
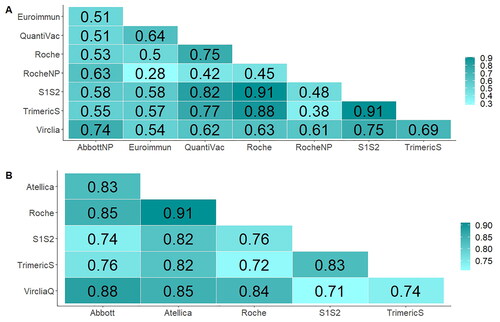
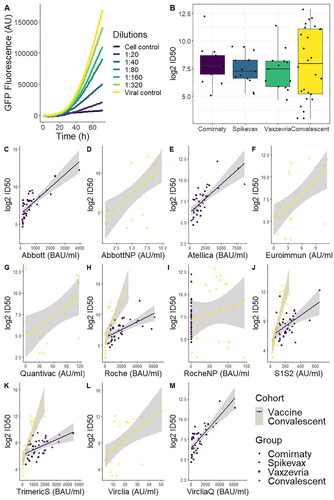
Figure 5. Representative data from the results of the neutralising antibodies assay. (A) GFP fluorescence was measured for 72h, with a cell control with no virus (blank) and a viral control with no antibodies (0% inhibition). (B) Boxplot of the 50% inhibitory dilution for all cohorts. All pairwise comparisons were non-significant (t-test). (C–M) Scatterplot of all test results (antibodies in serum) compared to the ID50 values from the neutralising antibody assay. The grey area shows 95% confidence of the linear approximation.