
Figures & data
Table 1. Building a performance measurement plan: basic level.
Table 2. Building a performance measurement plan: intermediate level.
Table 3. Building a performance measurement plan: advanced level.
Fig. 1. Building A electrical use profile.
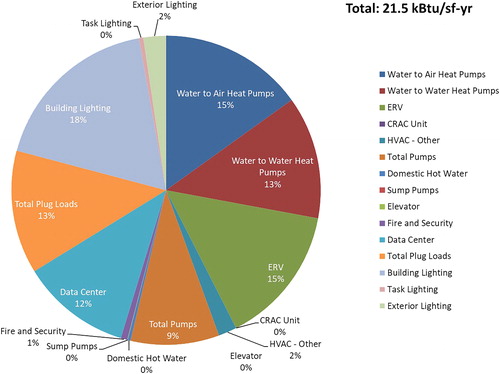
Fig. 2. Building C electrical use profile.
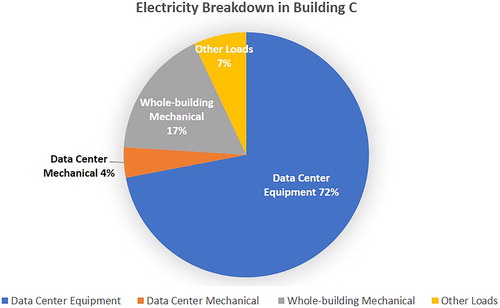
Fig. 3. Building A daily electric energy use vs. outside air temperature.
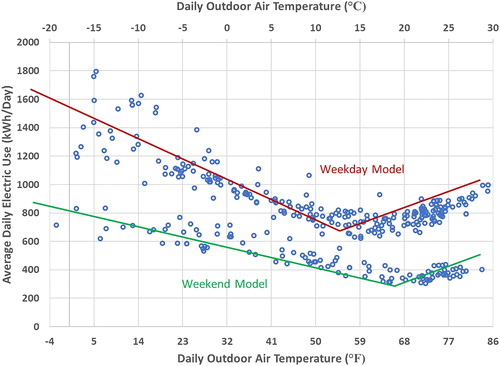
Table 4. Building 4-parameter change-point linear model parameters.
Table 5. Building C WUI calculations.
Table 6. Building C water/occupant calculations.
Fig. 4. Building A BUS survey result: thermal comfort in summer.
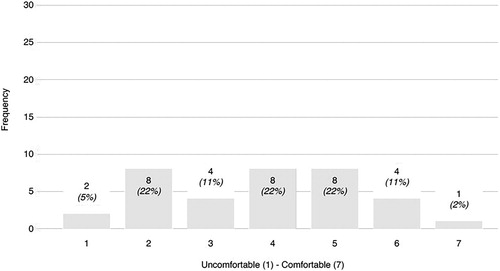
Fig. 5. Building A BUS survey result: thermal comfort in winter.
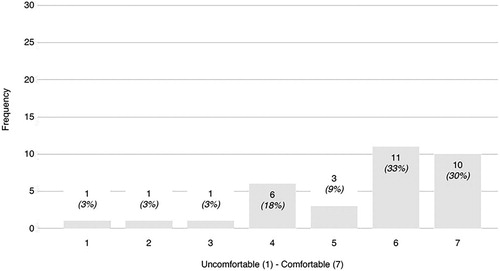
Fig. 6. Building A BUS survey benchmarking: temperature comfort in summer.
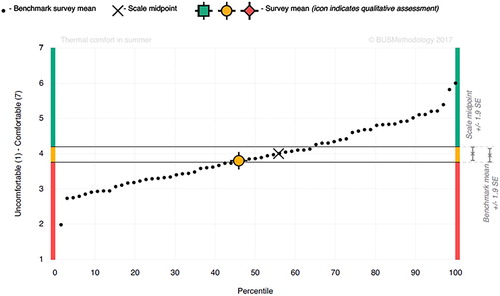
Fig. 7. Building A BUS survey benchmarking: temperature comfort in winter.
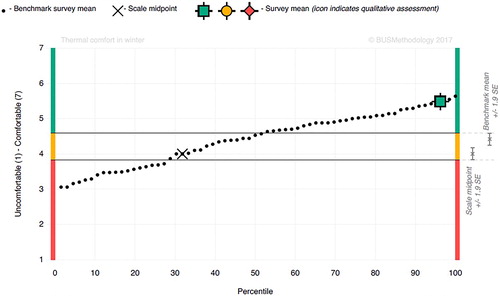
Fig. 8. Predicted mean vote (a) winter and (b) summer for the break room.
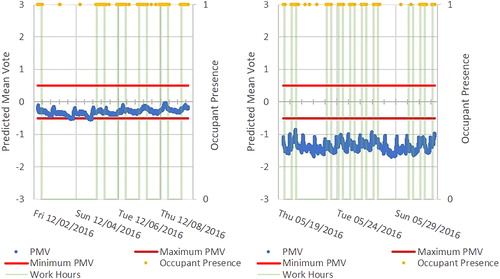
Fig. 9. Predicted percentage dissatisfied (a) winter and (b) summer for the break room.
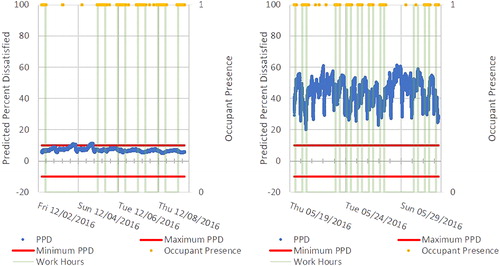
Fig 10. Return air grille location in research lab.
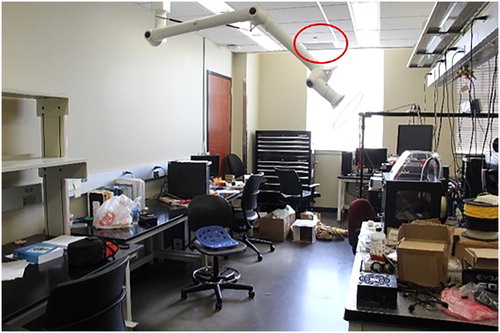
Fig. 11. One-week measurement of return air CO2 level, building D.
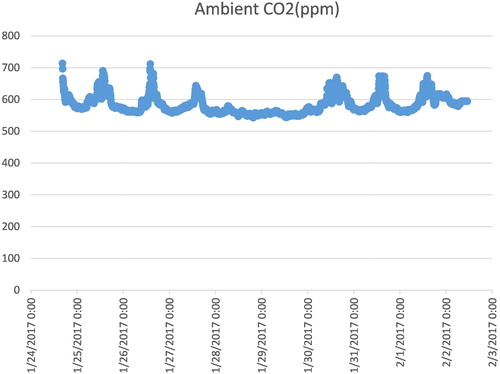
Fig. 12. CO2 concentrations, (a) winter and (b) summer in the conference room.
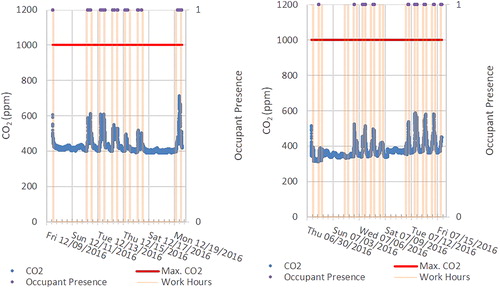
Table 7. Building A luminance comparison for the private office.
Table 8. Building A luminance comparison for the open office.
Table 9. Building A luminance ratio using HDR images.
Fig. 13. Reverberation time measurement locations for the conference room (locations: “m” = measurement location; “pos.” = locations where balloons were popped).
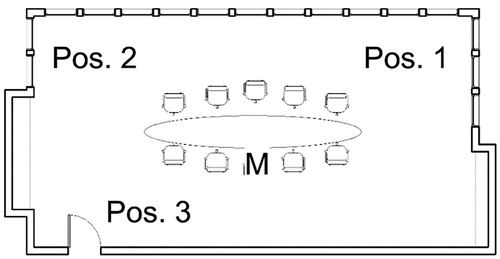
Table 10. Reverberation time results for the conference room.
Table 11. Summary of findings.