Figures & data
Table 1. Energy savings from CO2-based DCV from literature review.
Table 2. Three CO2-based dynamic reset strategies proposed by RP-1547 (Lin et al. Citation2013).
Fig. 1 VAV control schematic.
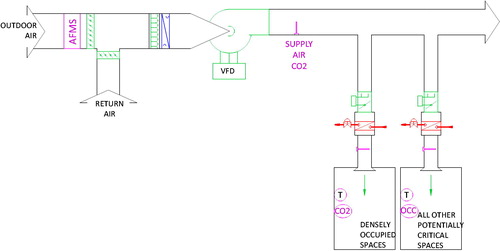
Fig. 2 Flow chart for zone with CO2 sensors.
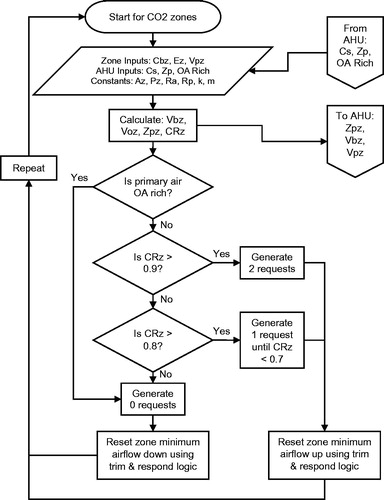
Fig. 3 Flow chart for zone with occupancy sensors.

Fig. 4 Flow chart for zone with no CO2 or occupancy sensors.
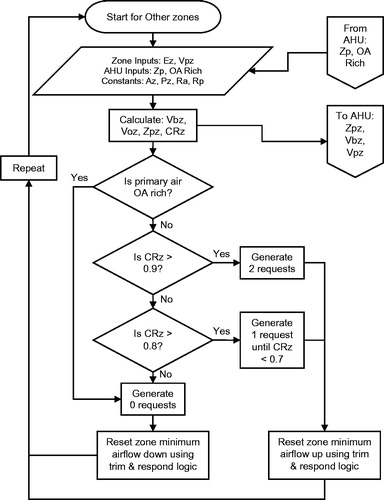
Fig. 5 Flow chart for air handler.
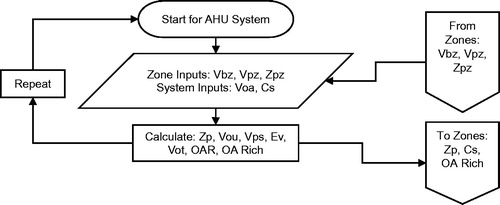
Fig. 6 Flow chart for generating coupling files through Functional Mockup Unit (FMU).
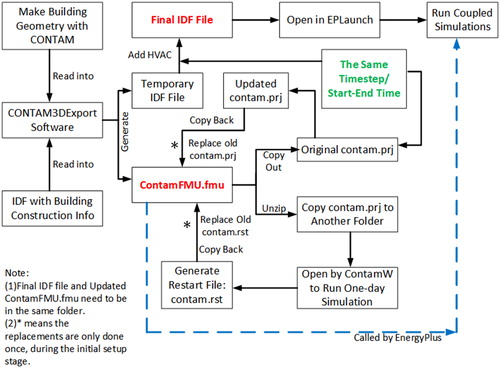
Table 3. Coupling approach 1 (not adopted).
Table 4. Coupling approach 2 (not adopted).
Table 5. Coupling approach 3 (adopted).
Fig. 7 Flow chart for coupling between EnergyPlus and CONTAM.
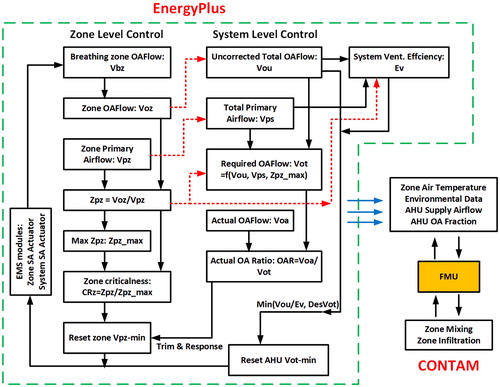
Fig. 8 EnergyPlus zone CO2 concentration calculation variables overwritten by CONTAM.
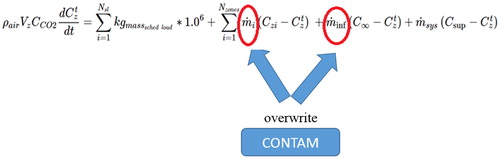
Fig. 9 ERS building outlook, rendered geometry, and floor plan.
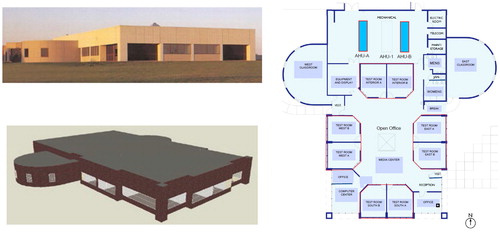
Fig. 10 CONTAM model for ERS building.
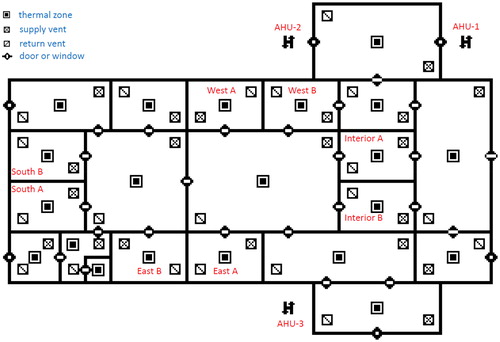
Table 6. Summary of occupancy type and internal loads in the ERS building.
Fig. 11 Weekly occupancy schedule.
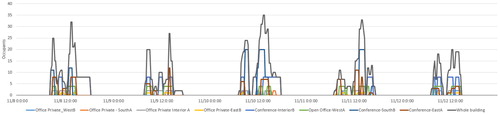
Table 7. Economizer high limit shutoff dry bulb temperatures.
Fig. 12 Flow chart for EnergyPlus EMS module with RP-1747 logic.

Table 8. Zone air flow minimums for two baselines without DCV.
Table 9. System outdoor air minimums for two baselines without DCV.
Table 10. AHU Maximum air flow rates in four climate zones.
Table 11. ERS annual HVAC energy savings from DCV logic compared to baselines.
Fig. 13 HVAC source energy consumption by end-use and climate zone.
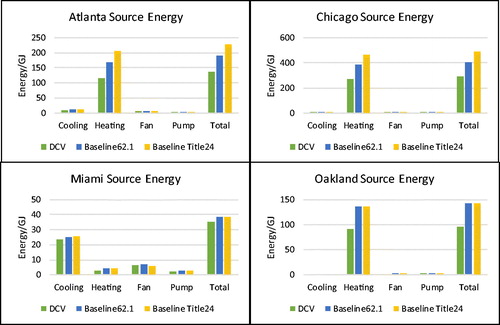
Fig. 14 AHU outside air (OA) and supply air (SA) flow probability density function (PDF) curve in Chicago from annual simulations.
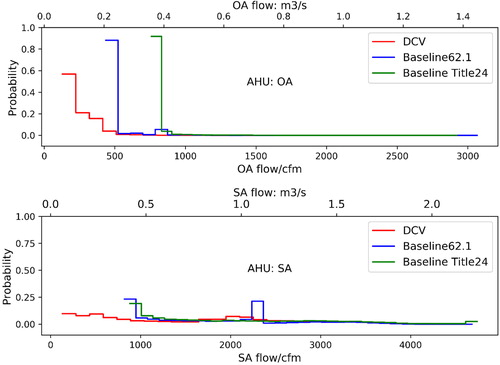
Fig. 15 Zone air flow rate (Vpz) for eight test rooms in Chicago from annual simulation.
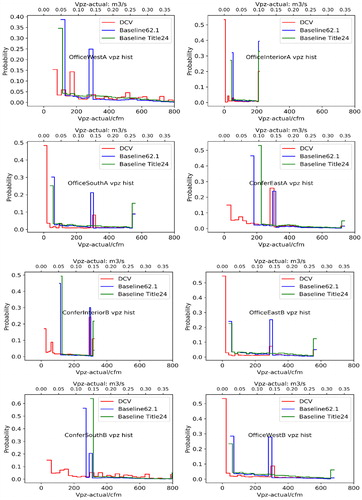
Fig. 16 Zone air flow minimums (Vpz-min) for eight test rooms in Chicago from annual simulations.
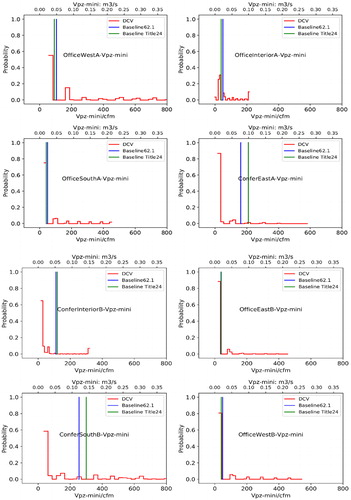
Fig. 17 Zone minimums vs. Voz in Chicago (one week in January and one week in July).
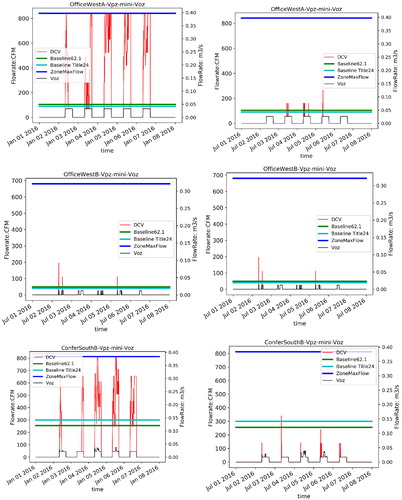
Fig. 18 Outdoor air temperature vs. outdoor air flow rate in Chicago and Oakland.
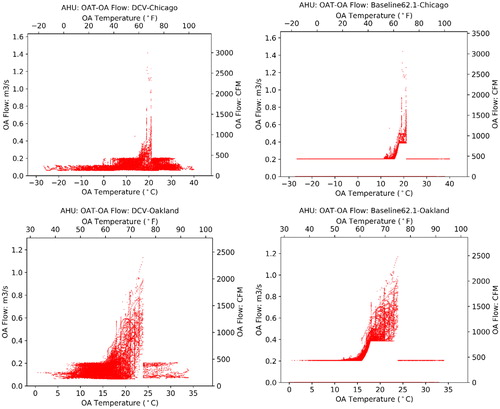
Fig. 19 Zone primary outdoor air fraction (Zpz) in Chicago and Oakland.
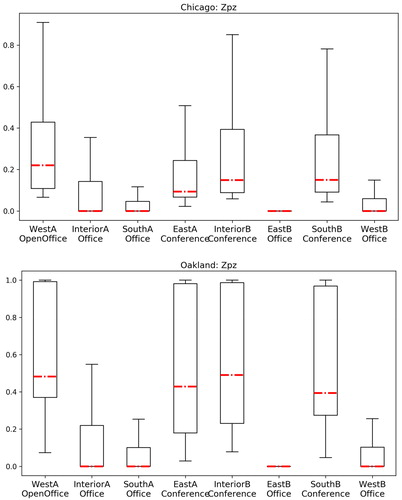
Fig. 20 Zone criticality ratio (CRz) in Chicago and Oakland.
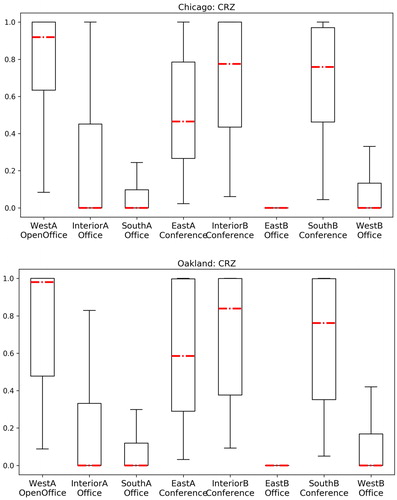
Fig. 21 System ventilation efficiency in Chicago and Oakland.
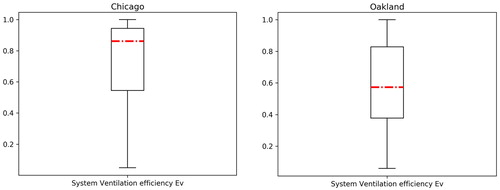
Fig. 22 Histograms of outdoor air ratio for ERS Building in four climate zones (hourly data).
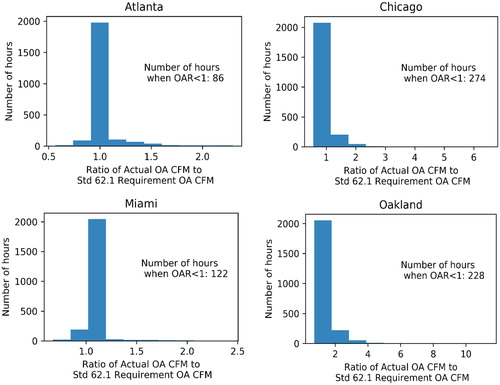
Table 12. Simulated compliance rate with Standard 62.1 ventilation rates for ERS building.
Fig. 23. Time series plot of simulated zone performance – ERS, Office West A, Atlanta.
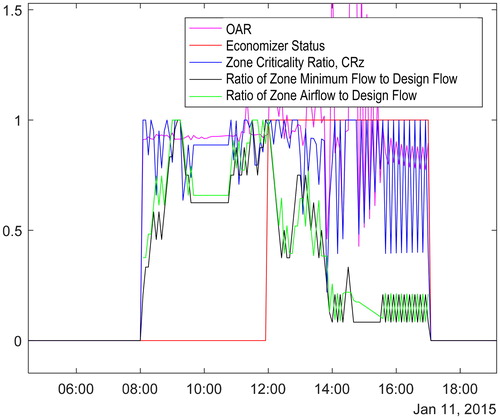
Fig. 24 Sensitivity of system ventilation performance to design Ev (Chicago).
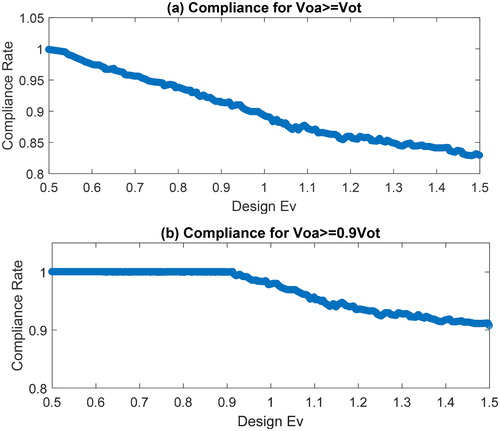
Fig. 25 Ratio of required ventilation rate (Vot) between DCV to non-DCV baseline in Chicago.
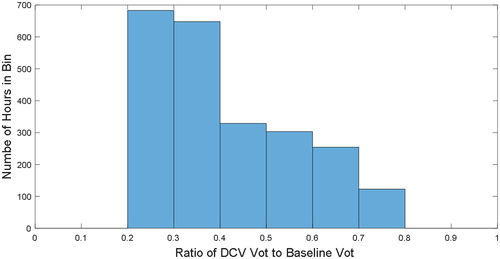
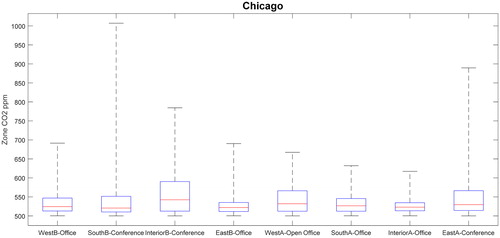
Fig. 26 Zone CO2 concentrations from an annual simulation in Chicago.