Figures & data
Fig. 1 Flow recirculation zones and other geometrical exhaust parameters (ASHRAE 2019-Modified).
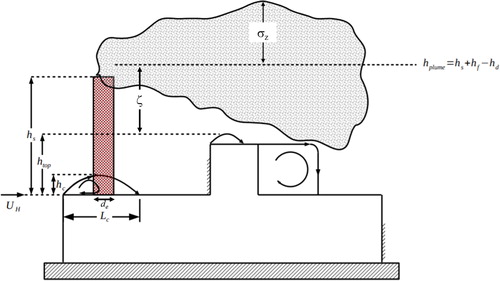
Fig. 2 Observed and predicted dilutions for Hajra, Stathopoulos, and Bahloul (Citation2011) (Points are measured observations and curves are model predictions).
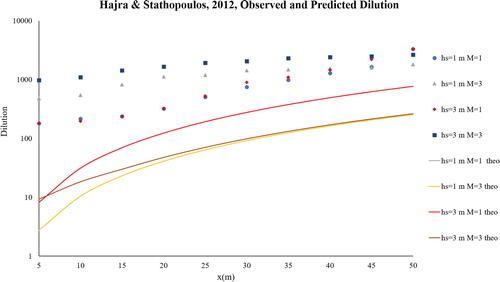
Fig. 3 Observed and predicted dilutions from Gupta, Stathopoulos, and Saathoff (Citation2012) (Points are measured observations and curves are model predictions).
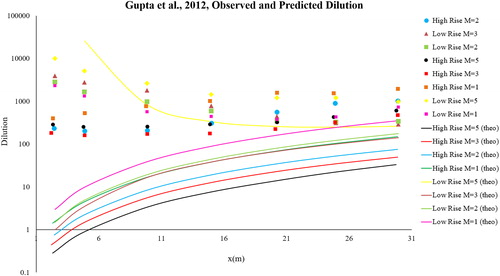
Fig. 4 Observed and predicted dilutions from Petersen, Carter, and Ratcliff (Citation1997) (Points are measured observations and curves are model predictions).
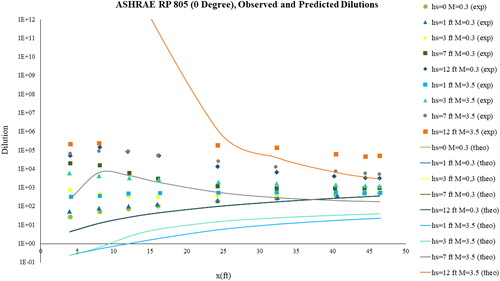
Fig. 5 Observed and predicted dilutions from Schulman and Scire (Citation1991) (Points are measured observations and curves are model predictions).
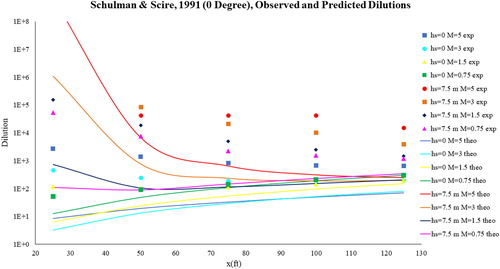
Fig. 6 Observed and predicted dilutions from Wilson and Chui (Citation1994) (Points are measured observations and curves are model predictions).
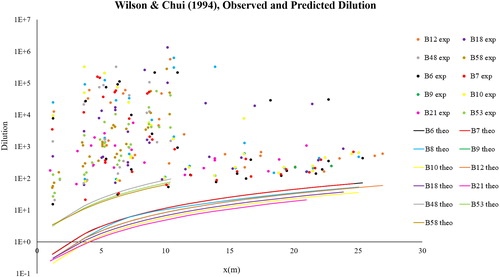
Fig. 7 Observed and predicted dilutions from Wilson and Lamb (Citation1994) (Points are measured observations and curves are model predictions).
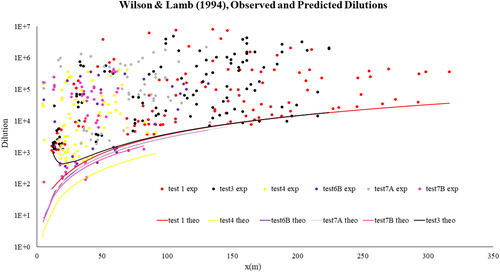
Table 1 Progressive improvement of model through addition of variables and effect on objective function.
Table 2 Physical meaning of defined parameters.
Table 3 Optimized values checked on other data sets results.
Fig. A1 Relationship between htop and hplume for three different scenarios.
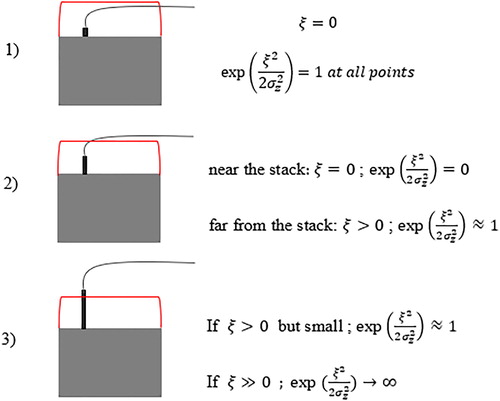
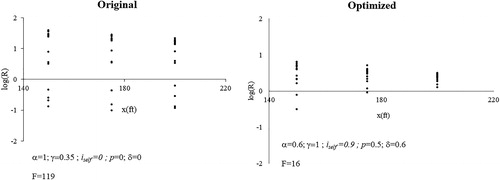
Fig. B1 Log of dilution ratio versus distance from the stack (Original).
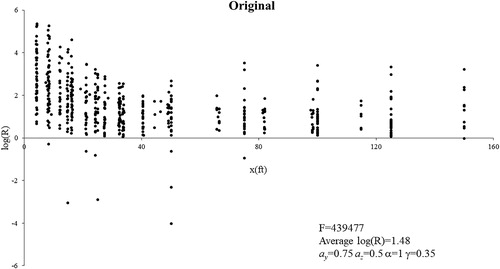
Fig. B2 Log of dilution ratio versus distance from the stack (With cutoff).
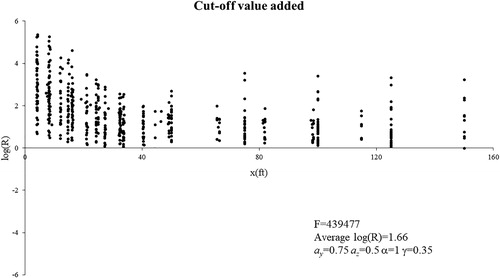
Fig. B3 Log of dilution ratio versus distance from the stack (Optimized with the variable γ).
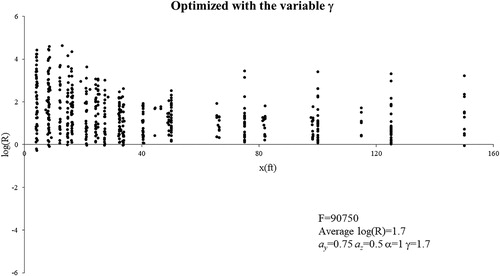
Fig. B4 Log of dilution ratio versus distance from the stack (Optimized with the variables α and γ).
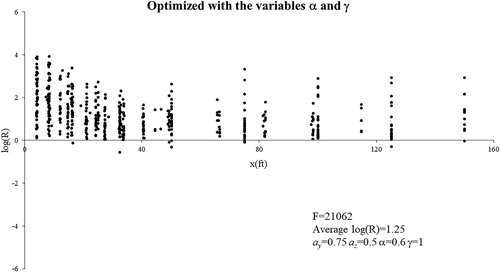
Fig. B5 Log of dilution ratio versus distance from the stack (Optimized with the variables α, γ, iself, p and δ).
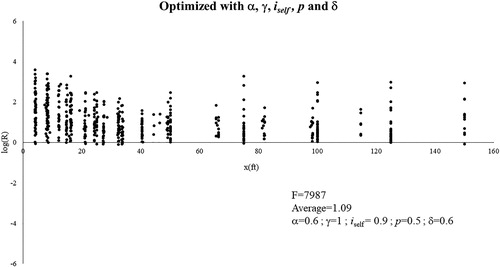
Fig. B6 Original and optimized dilution predictions for Wilson and Chui (Citation1994).
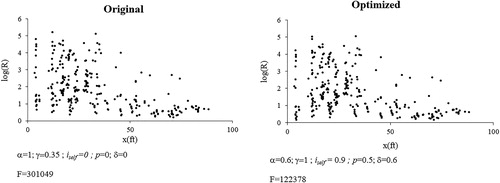
Fig. B7 Original and optimized dilution predictions for Wilson and Lamb (Citation1994).
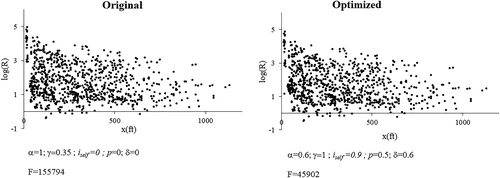
Fig. B8 Original and optimized dilution predictions for ASHRAE RP 805 (Tests with Screen).
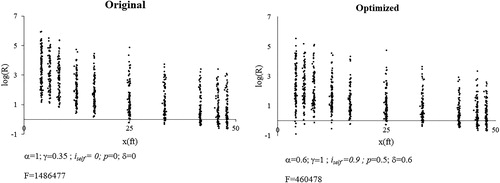
Fig. B9 Original and optimized dilution predictions for Schulman & Scire (Hidden Intakes).