
Figures & data
Fig. 1. Photo showing the classroom space used as a testbed for the current study (in a pre-COVID-19 layout).
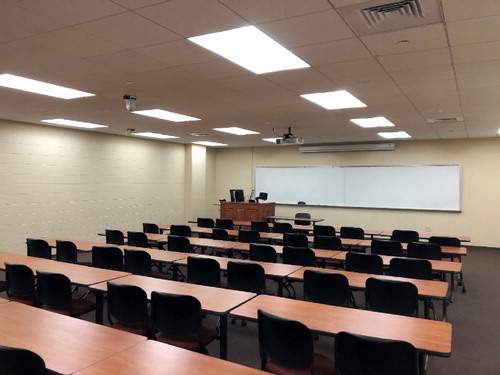
Fig. 2. (a) Schematic of the classroom layout used as a testbed for the current study, showing the locations of desks where student manikins were located (student desk), additional desks that were empty (vacant desk), the instructor podium at the front of the room, and the supply diffusers and return and (b) classroom layout showing setup for mapping distribution of concentration within the classroom. Number locations indicate positions where aerosol concentration was measured. Location of single student manikin emitting aerosol during the measurements is indicated by a green dot.
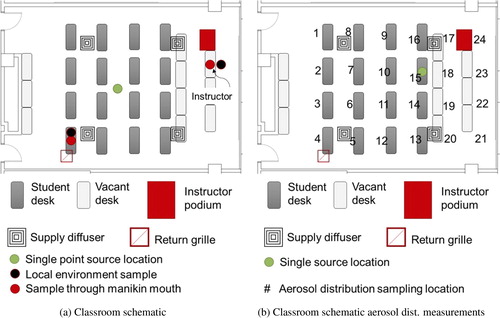
Fig. 3. Classroom space setup with manikins (a) view from the front of the room looking back and (b) from the back of the room looking forward.
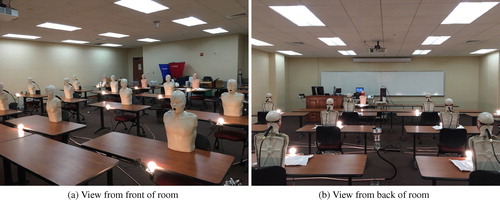
Fig. 4. a. NaCl aerosol size distribution as a function of aerodynamic diameter (dA) generated by the aerosol generator measured directly after dilution. b. NaCl aerosol size distribution measured with the ELPI during filtration efficiency measurements measured at position 4 in after steady-state was reached. Error bands representing uncertainty due to random variations during the averaging interval are smaller than the symbols used and are not visible in the plot.
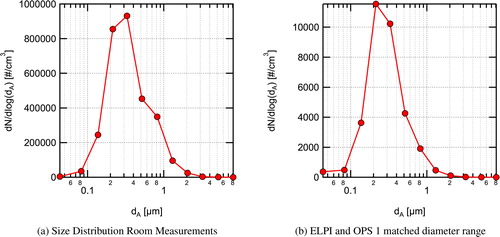
Fig. 5. Aerosol concentration in the classroom during buildup of aerosol from a single source located at the center of the room and during the decay of aerosol following shutoff of the aerosol source. a. Aerosol concentrations normalized by their peak value for all four instruments used; and b. Measured time-resolved aerosol concentrations in the front and rear of the room for a similar range of diameters. Aerosol seeding was started at 10:20 am and stopped at 11:20 am. Measurements are for approximately matched size ranges from ∼0.7 μm to 10 μm.
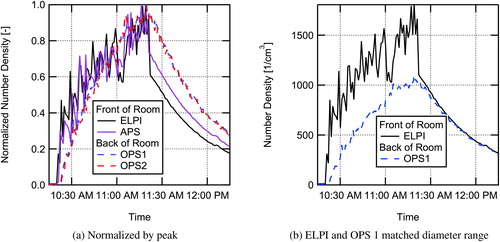
Fig. 6. Decrease in aerosol concentration in the room when switching from low flowrate of 1.34 ACH to a high flowrate of 5.05 ACH while constantly seeding aerosol into the room. Measured with the ELPI for particle sizes from 0.043 μm to 10 μm.
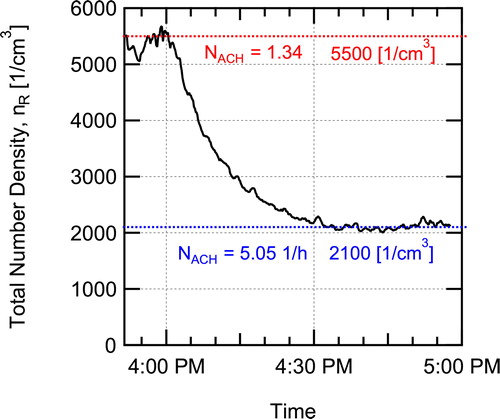
Fig. 7. Relative concentration point measurements (markers) and spatially interpolated relative concentration distributions (relative concentration is the local concentration divided by the lowest concentration measured in the room for each diameter and each case) for (a) no masks donned and average aerosol diameter of 0.728 μm and (b) 2.71 μm; (c) masks on and average aerosol diameter of 0.728 μm and (d) 2.71 μm. Note that higher relative concentration does not indicate higher absolute concentrations.
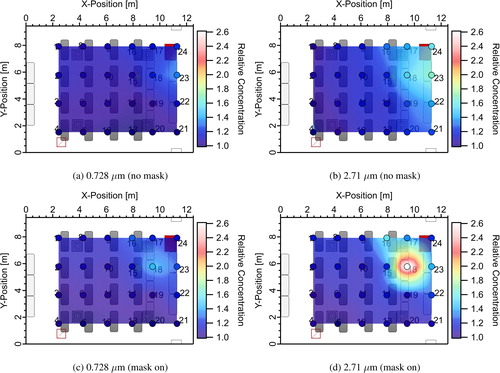
Fig. 8. Size-resolved effective filtration efficiency for inhalation measured in a classroom without a mask fitter used, with a Badger Seal mask fitter, and with a FTM mask brace installed for (a) the 4-ply knit cotton mask, (b) the EOC 3-ply spunbond polypropylene mask, (c) a single-use procedure mask, and (d) an ASTM F2100 level-2 rated surgical mask.
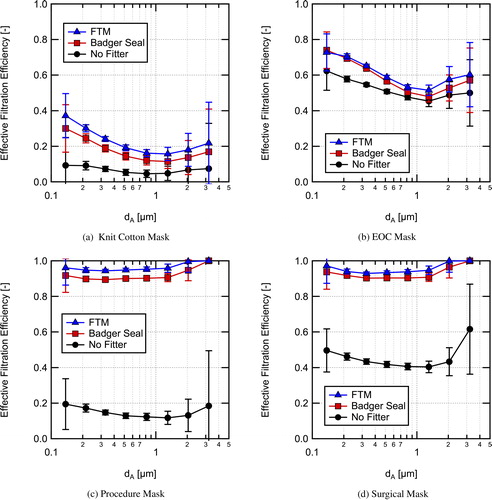
Fig. 9. Overall effective filtration efficiency for inhalation for the four masks tested in this work measured without a mask fitter, with the Badger Seal mask fitter, and the FTM mask brace used.
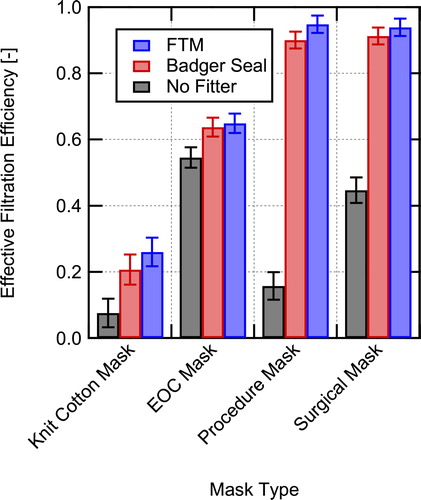
Table 1. Measured total effective filtration efficiencies and associated uncertainties during simulated inhalation for masks installed on a manikin in a classroom setting.
Fig. 10. Estimated fraction of flow that leaks around the masks without use of a mask fitter, calculated using EquationEquation 9(9)
(9) .
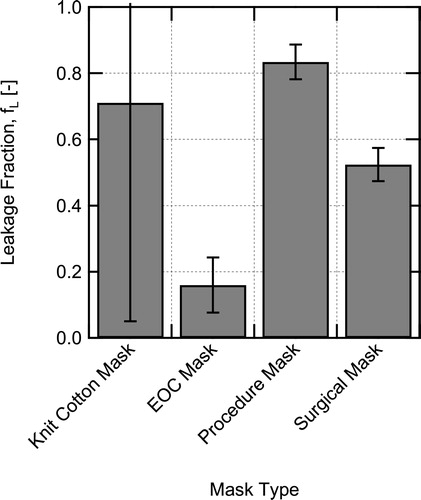
Table 2. Scenarios used for the infection probability calculations.
Table 3. Parameter values for Wells–Riley conditional infection probability estimates.
Fig. 11. Estimated conditional probability of infection for aerosol transmission in a classroom for different intervention scenarios for (a) varying mask filtration efficiency () and (b) varying number of air changes per hour (NACH).
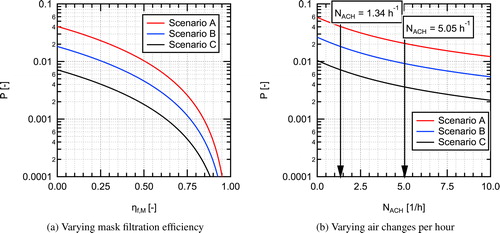
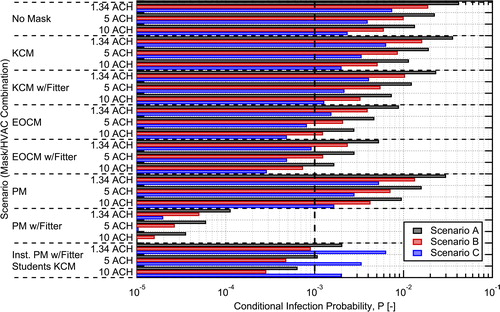
Fig. 12. Estimated conditional probability of infection for aerosol transmission in a classroom for different intervention combinations. A vertical dashed line is shown at the 0.001 conditional probability level. The mask abbreviations used on the graphs are: KCM = Knit Cotton Mask, EOCM = EOC Mask, PM = Procedure Mask.
Supplemental Material
Download PDF (10.6 MB)Data availability statement
Data that support the findings of this study are available from the corresponding author upon reasonable request.