Figures & data
Table 1. Descriptions of the confined spaces.
Table 2. Detailed information of the exposure scenarios.
Table 3. The quanta values of common airborne pathogen.
Fig. 1. Viral load in different specimens.
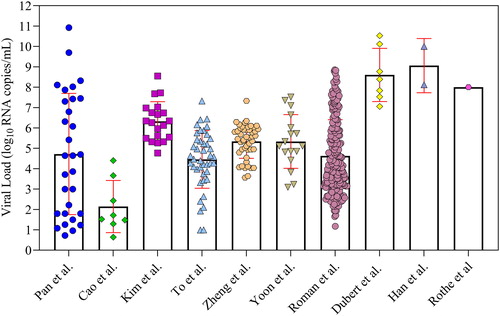
Fig. 2. Viral load distribution: (a) Histogram and Fitting Curve; (b) Normal Q-Q Plot.
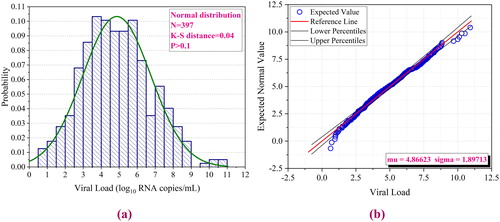
Fig. 3. Droplet concentrations fitting curve.
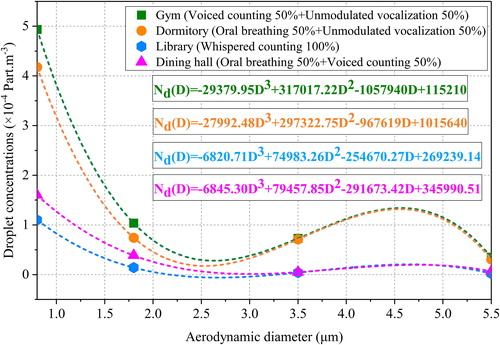
Fig. 4. Natural logarithm of the quanta generation rate under exposure scenarios.
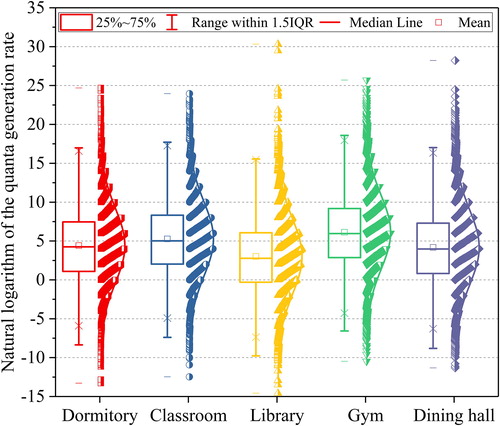
Fig. 5. The variations of and
(a) Dormitory; (b) Classroom; (c) Gym; (d) Library; (e) Dining hall.
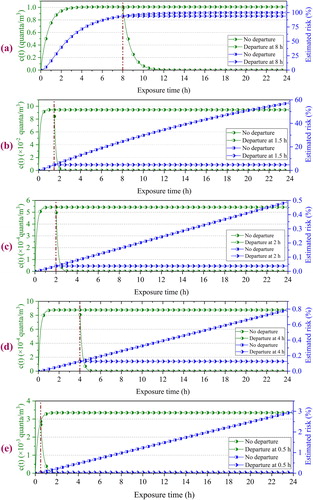
Fig. 6. Estimated with exposure time for the exposure scenarios.
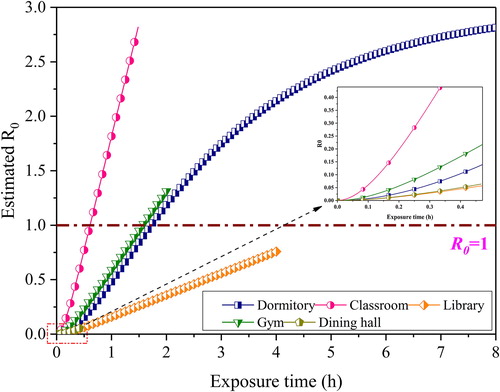
Fig. 7. The variations of estimated infection risk with ventilation rate: (a) Dormitory; (b) Classroom.
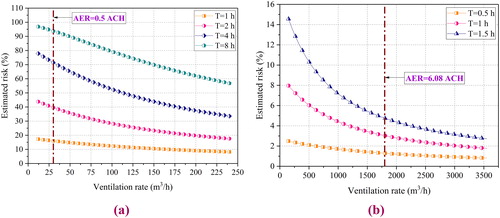
Fig. 8. with the different susceptible number and stay time.
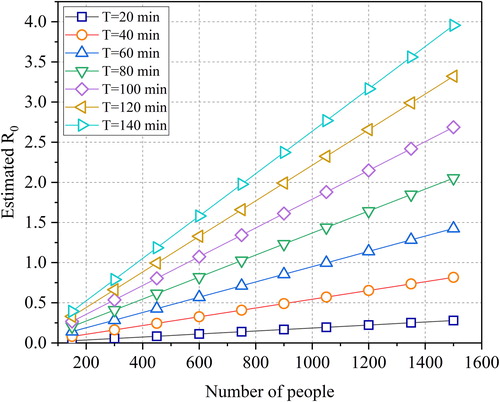
Table 4. Parameters of the control measures used in the infection risk model.
Fig. 9. The variations of estimated and
under combined engineering measures: (a) Dormitory;(b) Classroom; (c) Gym; (d) Library; (e) Dining hall.
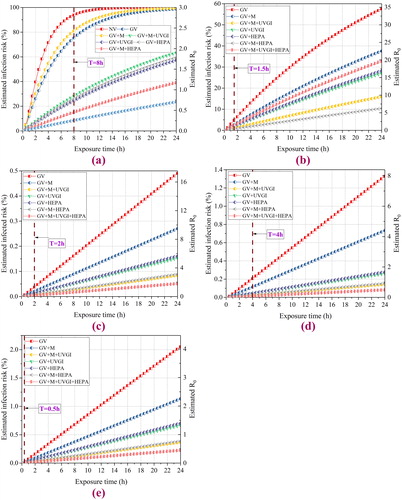
Fig. 10. The variations of estimated and
under some typical masks in the classroom.
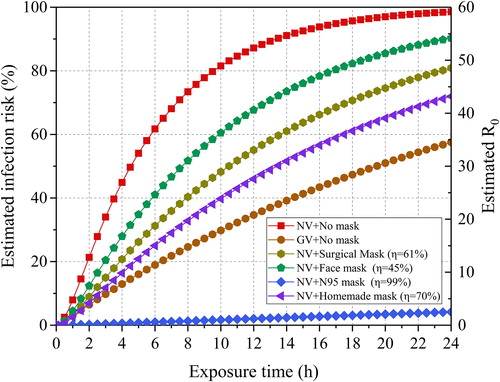
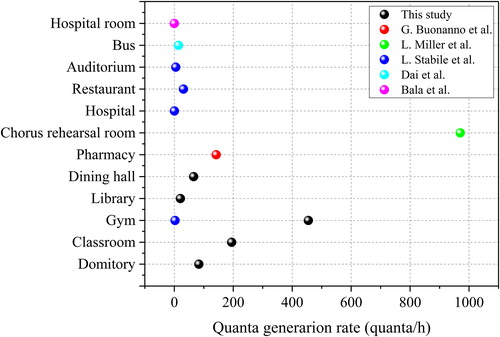
Fig. 11. Comparison of quanta generation rate in different scenarios.