
Figures & data
Fig. 1. (a) Illustration of cross-counter current FTHX design (top view). (b) Conceptual isometric model of the MPHX assembly place in a rectangular air duct, the inset picture depicts air and water flow passages, yellow arrows denote air and blue arrow denote water flow. Cut-away on water plates show the pin fins architecture within the water plates. Also shown are finned support structures on the air passage side.
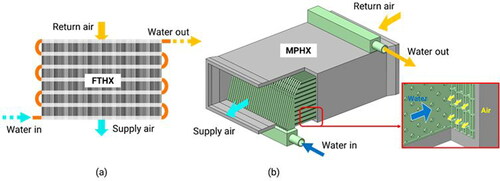
Fig. 2. Geometrical parameters used for the parametric study: (a) Side view of the MPHX showing water plates and air channels next to each other, (b) Top view of the pin array on water side.
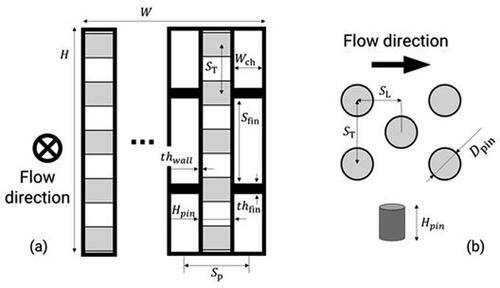
Table 1. Fixed and varied parameters in the MPHX design.
Fig. 3. (a) Parametric effect of variation of on MPHX effectiveness and air side pressure drop (b) Parametric effect of variation of HX length on MPHX effectiveness and air side pressure drop (c) Parametric effect of HX material conductivity on the effectiveness and thermal load of the MPHX.
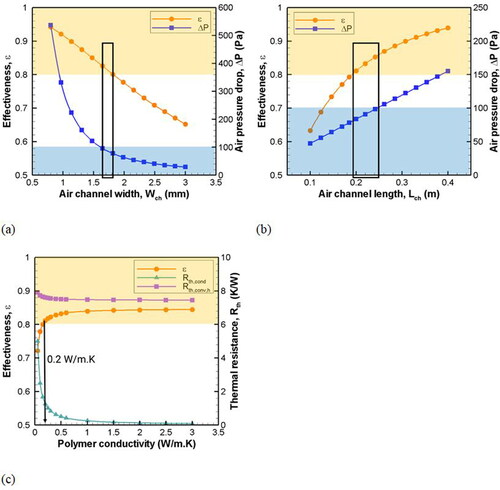
Fig. 4. Mechanical simulations of the MPHX water plate (a) Internal architecture of a single water plate in the MPHX (b) Repeating entity in the microchannel pin array design (c) Unit cell pin array meshed in the Ansys Mechanical, yellow arrows indicate surfaces exposed to 10 bar pressure. (d) Equivalent Von-Mises stress contours in the unit cell pin array revealing maximum 12.7 MPa stress at the base of pin fin (e) deformation in Y axis based on EPX82 properties.
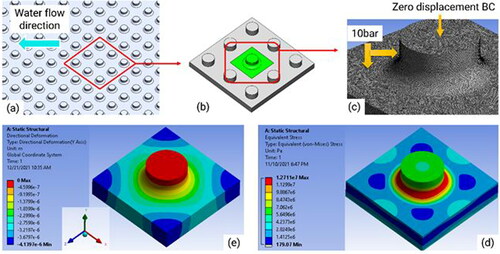
Fig. 5. (a) The fluid body within the MPHX inlet header that distributes the flow into stack of water plates. The inset picture with red circled section shows the part which porous media parameters were applied. (b) The estimated water in a pin array with 20 cm length by Short, Raad, and Price (2002) plotted against
used for porous media parameter calculation (c) Discharged mass flow rate into the stack of 55 water plates. The mean absolute deviation % from the target mass flow rate (0.2 g/s) for each of the plates is shown in second ordinate.
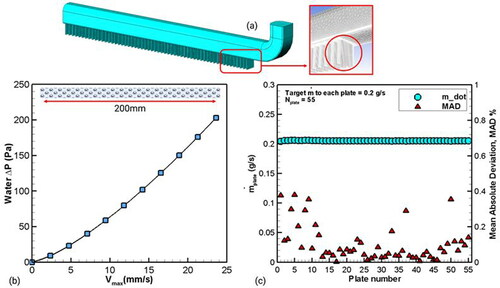
Fig. 6. Variants of monolithic small scale MPHX for 2in × 4in duct size in (a) 32 cm and in (b) 16 cm length with different header design. (c) Individual water plates used in the MPHX sub-scale demonstration assembly. (d) Overall look of the 3 D printed MPHX assembly with modular and scalable design that fits into a duct size of 5 cm × 20 cm (2in × 8in).
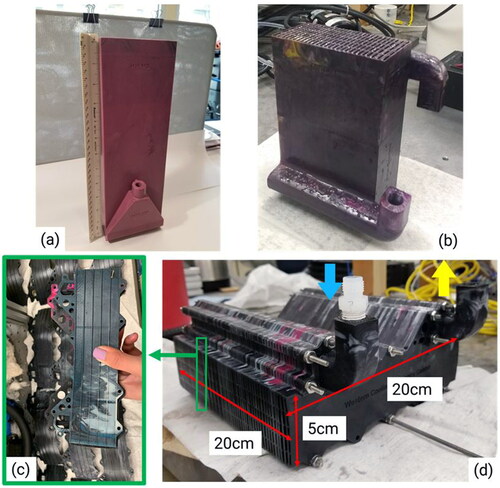
Fig. 7. (a) Picture of MPHX flow test loop (b) line schematic annotated with the loop components.
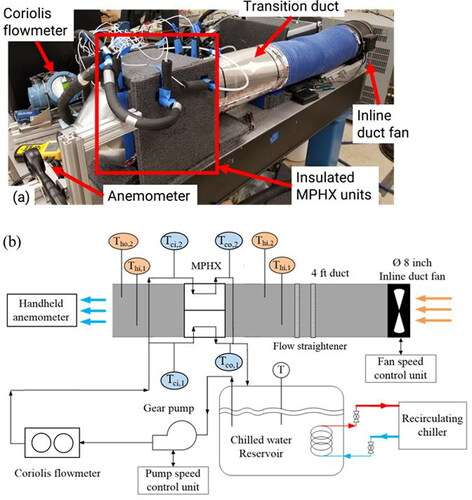
Table 2. Flow conditions and the range of variability during MPHX testing.
Table 3. Representative uncertainties of measurement and determined variables.
Fig. 8. (a) Subscale monolithic design of MPHX consisting of 5 water plates with integrated headers printed using EPX-82 resin (b) Static pressure testing, (c) Cyclic pressure testing (d) and (e) Pictures showing MPHX core outer walls and a few air channels at the end of experiments that showed no visible sign of failure.
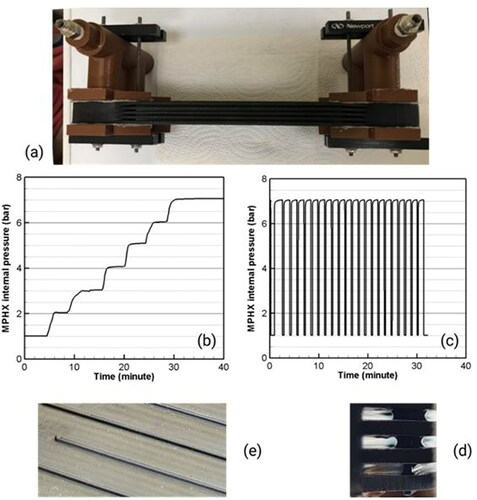
Fig. 9. (a) Air side pressure drop at different flow rates of air flowing through the air channels (b) Water side pressure drop at different flow rates of water flowing through the microchannel pin array plates.
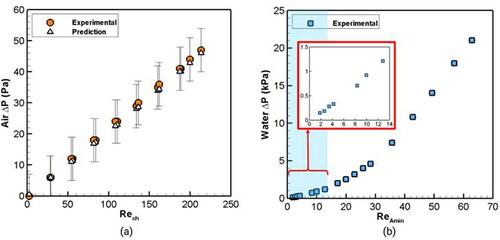
Fig. 10. MPHX bundle performance results (a) heat transfer rate trend against air stream Re for tested values. (b) variation of effectiveness with calculated NTU values for range of tested.
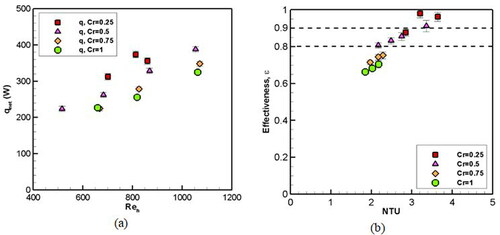
Fig. 11. Comparison of experimental correlation-based model results for (a) overall conductance, UA and (b) Effectiveness.
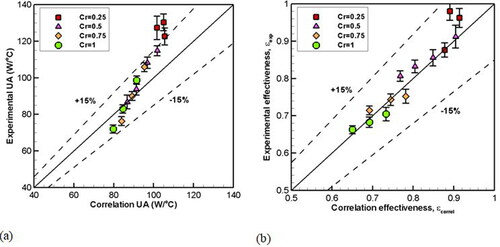
Fig. 12. Comparison of effectiveness and heat rate vs heat exchanger length in a FTHX and MPHX with cross section of 0.61 m × 0.61 m (2 ft × 2 ft). Pressure drop across a 20 cm long MPHX and FTHX are 84 and 88 Pa respectively.
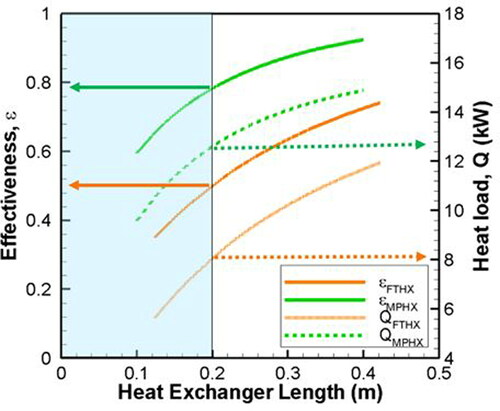
Table 4. FTHX geometry (matching Emergent Coil model no. 5W24X24-610-ZRC).