
Figures & data
Fig. 1. Conceptual groundwater heat pump (GWHP) system design in Melhus, Norway. HE = heat exchanger. System monitoring of p = pressure, T = temperature, P = heat output, W = power input, Q = groundwater pumping rate is displayed (modified from Gjengedal et al. Citation2021).
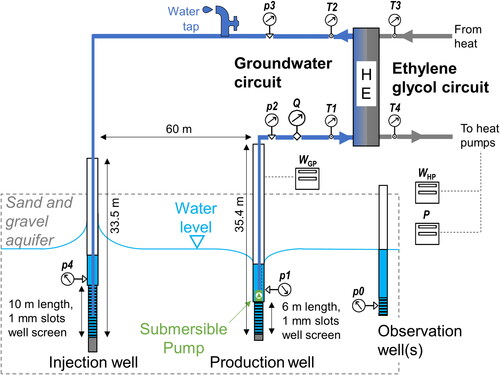
Fig. 2. Operational problems of GWHP systems related to low and high groundwater pumping rates (Q).
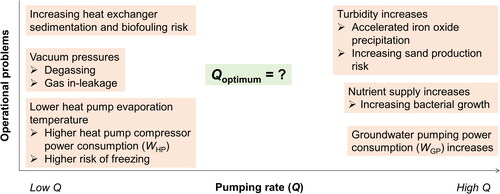
Fig. 3. Heat performance data from Lena terrasse GWHP system between May 2019 and April 2022. Red outline = data periods when changes in SPFM do not positively correlate with delivered heat. P = delivered heat from heat pump, SPFM = monthly performance factor (Equationeq. 3(3)
(3) ), Q = average groundwater pumping rate.
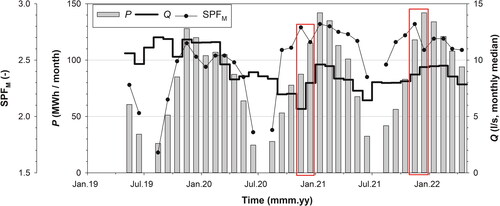
Fig. 4. Hydraulic performance of production well (a), injection well (b), heat exchanger (c) and submersible groundwater pump (d) between August 2019 and April 2022. Data points are calculated from step-discharge test results (Bi- and Ci-values) to the reference groundwater pumping rate Q = 8 l/s (Equationeq. 5(5)
(5) and Equation6
(6)
(6) ). Δpi = pressure drop/drawdown, WGP = submersible pump power consumption, rehab. = rehabilitation.
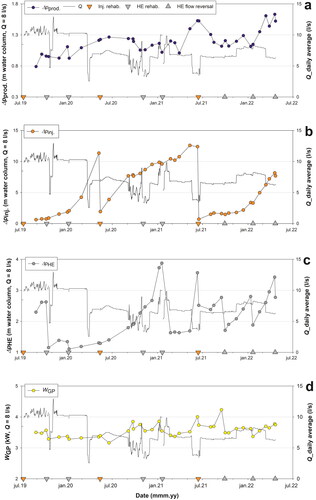
Fig. 5. Hydrochemistry measurements during a prolonged step-discharge test 8 October 2019. Q = groundwater pumping rate, DO = dissolved oxygen, EC = electrical conductivity, Fe2+ = dissolved iron, Mn2+ = dissolved manganese. Percentages refer to pumping frequency relative to the maximum.
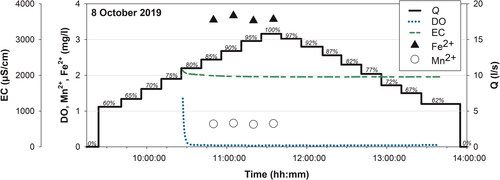
Fig. 6. Turbidity and suspended solids (from manual particle counting) of water samples taken during two step discharge tests at Lena terrasse 16 September (left) and 1 October (right) 2021. Percentages refer to pumping frequency relative to the maximum.
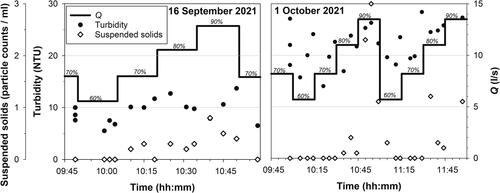
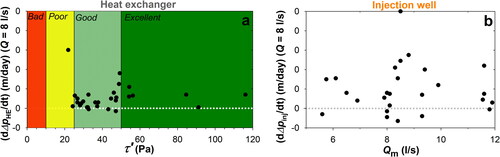
Fig. 7. Operating conditions for heat exchanger (a) and injection well (b) versus clogging rate (dΔpi/dt) in the period dt = tn-tn-1. = background plate shear stress prior to clogging (Equationeq. 7
(7)
(7) ). Heat exchanger plate shear stress (
) categories (“bad”, “poor”, “good” and “excellent”) are from Novak (Citation1982, Citation1983) and Kerner (Citation2011). Qm = median pumping rate in the period (dt = tn-tn-1).
Data availability statement
The authors agree to share their research data. These will be made available at a Mendeley Data repository (reserved doi: 10.17632/pc69rcs94y.1).