Figures & data
Fig. 1. Schematic illustration of the experimental setup for performance evaluation of the desiccant-coated heat exchanger under dynamic testing conditions.
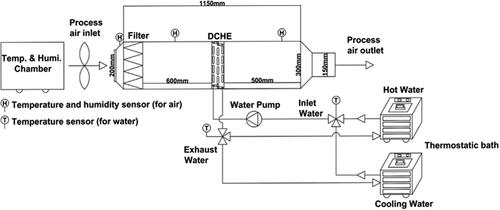
Table 1. Major equipment lists for the experimental setup.
Fig. 2. BET analysis of MOF (A520) and Sorbead R to quantify the surface area and porosity of the desiccant materials.
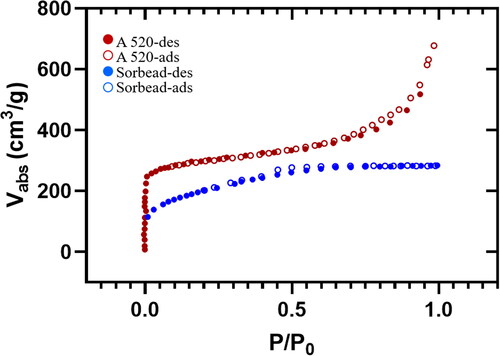
Fig. 3. Adsorption ability curves under environmental temperatures of 25 °C and 30 °C and relative humidity varying from 60% RH to 80% RH for (A) Sorbead R and (B) MOF-A520.
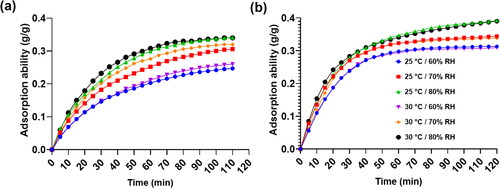
Table 2. Static adsorption ability of Sorbead R and MOF-A520 after 2 hours of adsorption under different environmental conditions.
Fig. 4. Adsorption capacities under environmental temperatures of 25 °C and 30 °C and relative humidity varying from 60% RH to 80% RH for (A) Sorbead R and (B) MOF-A520.
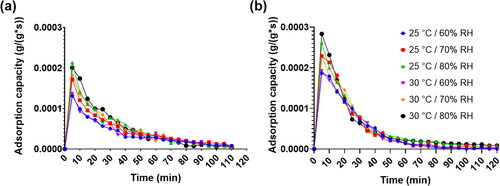
Table 3. Maximum static adsorption capacities () of the two desiccants under different environmental conditions.
Fig. 5. Total residual mass inside desiccants during the desorption process at an environmental temperature of 30 °C and a relative humidity of 70% RH for (A) Sorbead R and (B) MOF-A520 at different regeneration temperature (RT) settings.
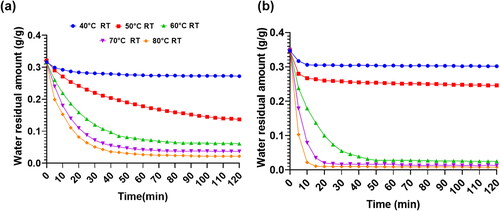
Table 4. Final residual amount per unit mass of MOF-A520 and Sorbead R with different regeneration temperatures under different environmental conditions.
Table 5. Water removal percentage of MOF-A520 and Sorbead R with different regeneration temperatures under different environmental conditions.
Fig. 6. Water removal capacity under an environmental temperature of 30 °C and a relative humidity of 70% RH for (A) Sorbead R and (B) MOF-A520.
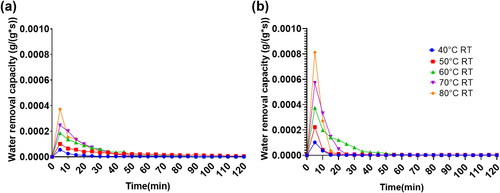
Table 6. Maximum desorption capacity per unit gram of MOF-A520 and Sorbead R under different environmental conditions and regeneration temperatures.
Fig. 7. Humidity ratio of the process air behind the DCHE in dynamic operation under the process air supply temperature and the relative humidity of 30 °C and 80%RH with different regeneration temperatures. The inset picture highlights the dehumidification curve for each tested regeneration temperature.
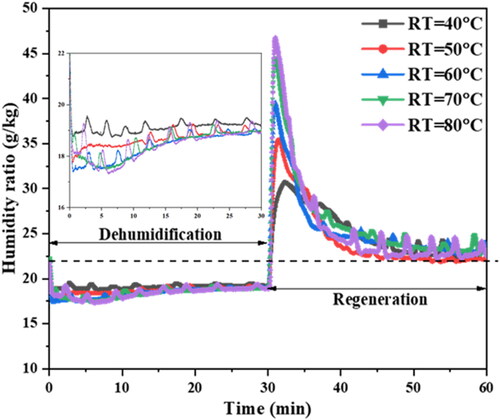
Table 7. Corresponding characteristics of the DCHE with MOF-A520 in dynamic operations under different process air humidity conditions and regeneration temperatures with a process air temperature of 25 °C and 30 °C. Gvap, GA, and GD denote the total vapor absorption vapor amounts, ratio of absorption vapor amounts per unit contact area of fins and vapor absorption amounts per unit mass of MOF-A520. The DEH and REG processes denote the dehumidification and regeneration processes, respectively.
Table 8. The corresponding specific moisture extraction ratio (SMER) values and thermal coefficient of performance (COPth) of the DCHE with MOF-A520 in dynamic operation under different process air environmental conditions and regeneration temperatures.
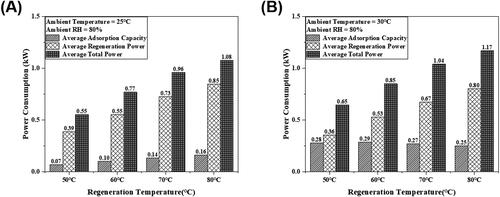
Fig. 8. Average cooling capacity in the dehumidification process, the required average regeneration power in the regeneration process and the total power consumption in dehumidification and regeneration processes with different regeneration temperatures under the (A) process air temperature of 25 °C and relative humidity of 80%. (B) Process air temperature of 30 °C and relative humidity 80%.