
Figures & data
Table 1. Test facility water heater model numbers, capacity and UEF.Table Footnotea
Table 2. Monitoring and instrumentation equipment specifications.
Fig. 1. Hot water test facility draw profiles for connected water heater experiment.
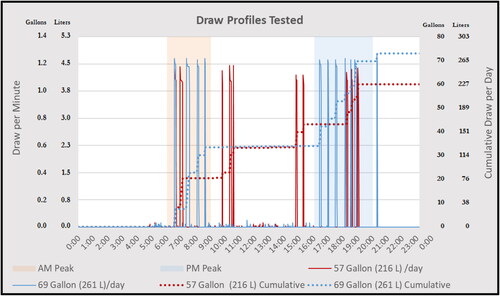
Table 3. Draw during load-up hours.
Table 4. Total daily and peak hours water heater energy and demand: shed versus critical peak.
Fig. 2. Outdoor and inlet water temperature, shed versus critical peak, warm weather.
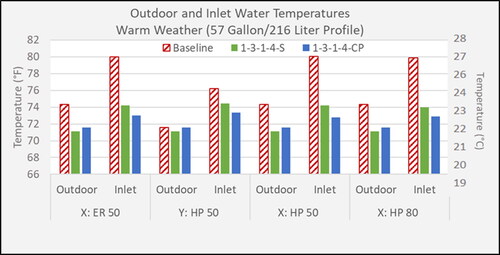
Fig. 3. Outdoor and inlet water temperatures, shed versus critical peak, cooler weather.
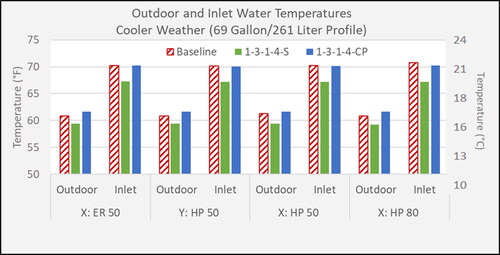
Table 5. Total daily and peak hours water heater energy and demand: 1-h versus 2-h load up.
Fig. 4. 1-3-1-4-S compared to 1-3-1-4-CP command structure, with ERWH baseline.
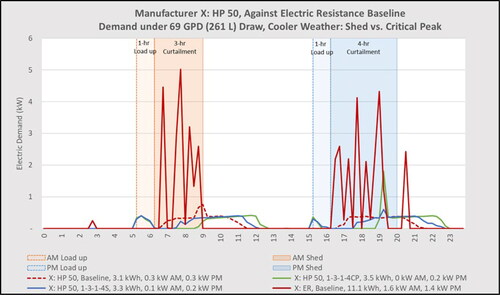
Fig. 5. “X: HP 50” unit under 1-3-1-4-S compared to 1-3-1-4-CP structure.
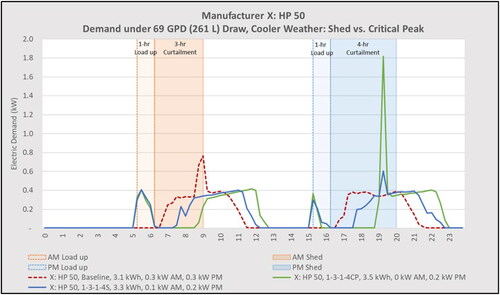
Table 6. Baseline performance for X:HP80 hybrid versus efficiency mode, under 57 G (216 L) per day draw profile.
Fig. 6. Baseline demand profile for “X: HP 80” hybrid versus efficiency mode, under 57 G (216 L) per day draw profile.
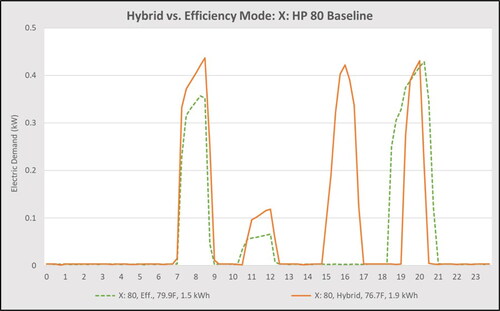
Table 7. Performance during 2-3-2-4-S command scheme, hybrid versus efficiency mode, under 57 GPD (216 L) draw profile.
Fig. 7. 1-5-1-6-CP demand profile for “Y: HP 50” and “X: HP 80” hybrid versus efficiency mode, under 57 G (216 L) per day draw profile.
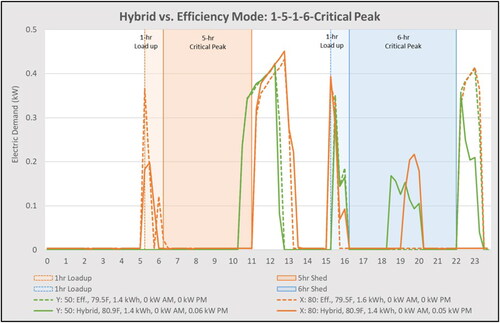
Table 8. Performance during 1-5-1-6-CP command scheme, hybrid versus efficiency mode, under 57 G (216 L) per day draw profile.
Fig. 8. Temperatures for manufacturer Z 50 G (189 L) HPWH with CTA-2045-B protocol capability including advanced load up capability.
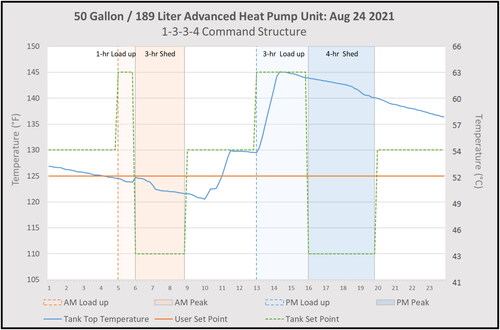
Fig. 9. Manufacture Z prototype CTA-2045-B unit under 1-3-3-4-S structure.
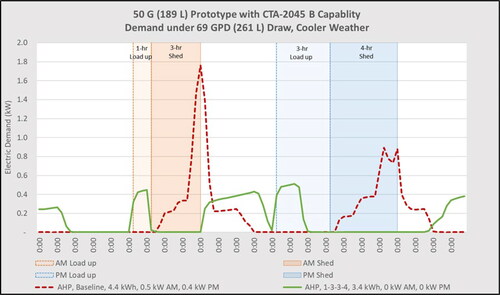
Table 9. Total daily and peak hours water heater energy and demand of advanced load up prototype.
Fig. 10. Repeated testing of the 0-5-4-6-S profile on 13 days of similar weather.
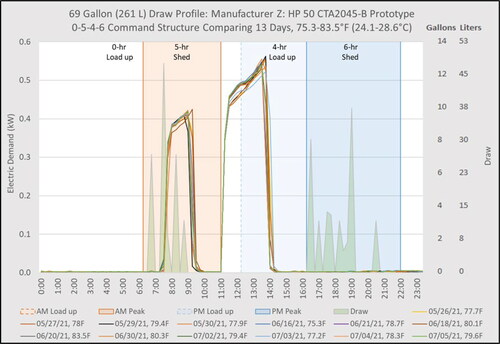
Fig. A1. Frost line depth in inches around the U.S. (Source: U.S. Weather Bureau).
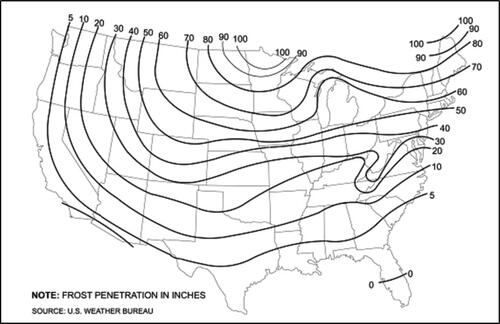
Fig. A2. Predicted vs. measured inlet water temperature in Cocoa, FL, 2021.
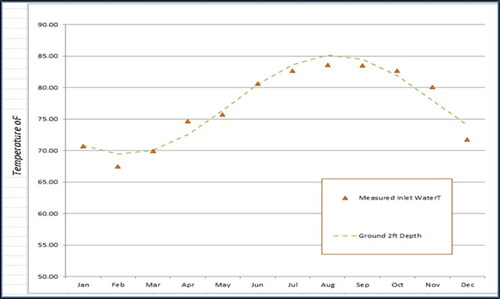
Fig. A3. Regression of measured inlet water temperature against prediction with hourly data.
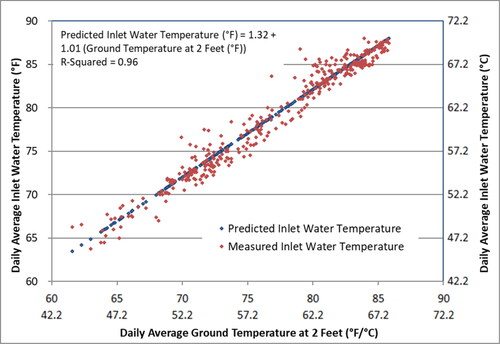
Fig. A4. Comparison of measured (blue) inlet temperature, ground temperature and outdoor air temperature.
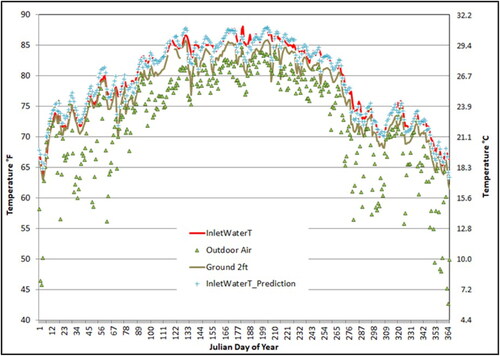
Table A1. Typical soil physical properties.
Table A2. Method estimate versus prediction for inlet water temperature of 2021 data.
Table B1. Shed versus critical peak: daily average outdoor, lab, and inlet, and minimum delivery temperatures (Fahrenheit).
Table B2. 1-h Versus 2-h load up: daily average outdoor, lab, and inlet, and minimum delivery temperatures (Fahrenheit).
Table B3. Hybrid (H) versus efficiency (E) 2-3-2-4-S: daily average outdoor, lab, and inlet, and minimum delivery temperatures (Fahrenheit).
Table B4. Hybrid (H) versus efficiency (E) 1-5-1-6: daily average outdoor, lab, and inlet, and minimum delivery temperatures (Fahrenheit).
Table B5. Shed versus critical peak: daily average outdoor, lab, and inlet, and minimum delivery temperatures (Celsius).
Table B6. 1-h Versus 2-h load up: daily average outdoor, lab, and inlet, and minimum delivery temperatures (Celsius).
Table B7. Hybrid (H) versus efficiency (E) 2-3-2-4-S: daily average outdoor, lab, and inlet, and minimum delivery temperatures (Celsius).
Table B8. Hybrid (H) versus efficiency (E) 1-5-1-6: daily average outdoor, lab, and inlet, and minimum delivery temperatures (Celsius).