Figures & data
Fig. 1. Fault naming framework used in the study.
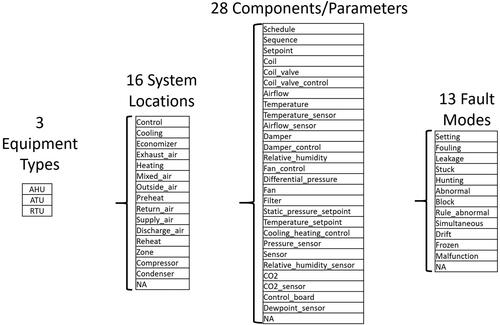
Fig. 2. Percent Time Faulted (PTF) calculation concept (“1” represents a day on which a fault was reported).
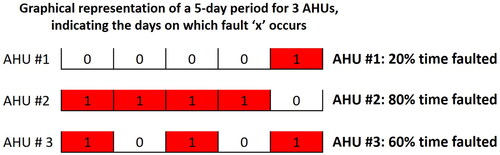
Fig. 3. Illustration of method to calculate percent of equipment operating in a faulted state.
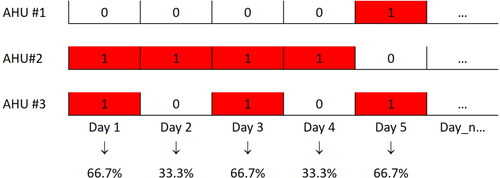
Table 1. Mean number of reported faults per month (AHU and ATU).
Fig. 4. Most commonly reported faults for AHUs, based on Pct_Affected value (chart shows faults 20% or higher).
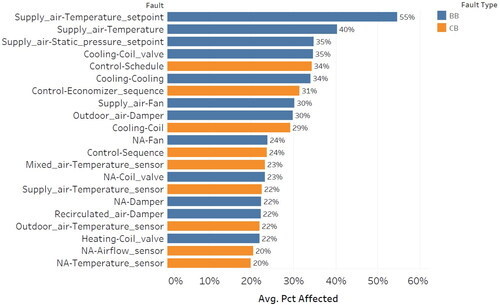
Fig. 5. Most commonly reported faults for ATUs, based on Pct_Affected value (chart shows faults 20% or higher).
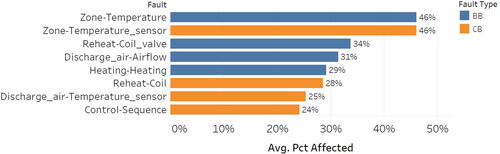
Fig. 6. Mean Percent Time Faulted, for AHUs experiencing a given fault at least once (MPTF_Affected). Chart shows faults with MPTF_Affected of 20% or greater, i.e., a given fault is reported on 20% or more of the days across which a piece of equipment was monitored.
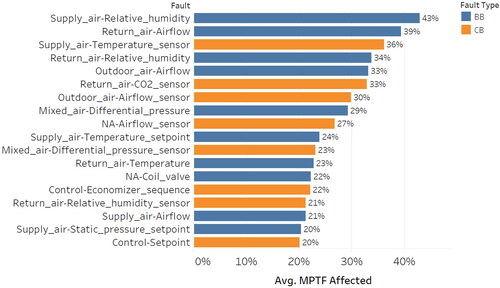
Fig. 7. Mean Percent Time Faulted, for ATUs experiencing a given fault at least once (MPTF_Affected). Excludes ATUs that never saw a given fault.
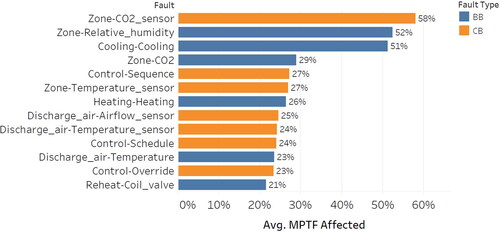
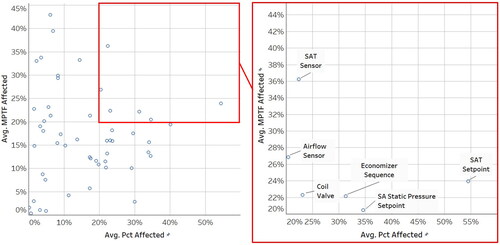
Fig. 8. Scatter chart of Pct_Affected vs. MPTF_Affected for AHU faults, highlighting the six faults that are both common (Pct_Affected ≥20%) and persistent (MPTF_Affected ≥20%).