Figures & data
Fig. 1. Overview of information in different CityGML LoDs, according to Malhotra et al. (Citation2019).
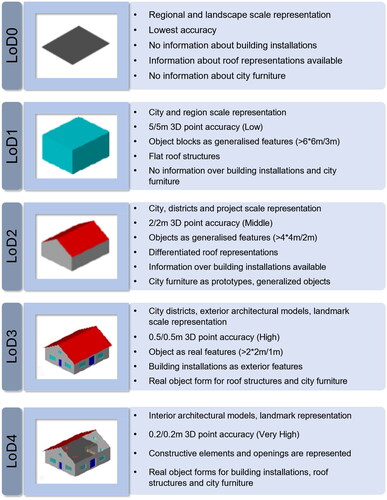
Table 1. Exemplary material layers for interior walls used in Teco and TEASER+.
Table 2. Exemplary calculation of environmental impacts in Teco.
Fig. 2. Overview of the enrichment architecture in Teco (Schildt et al. Citation2022).
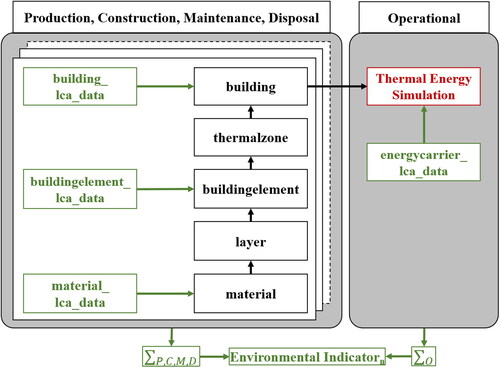
Fig. 3. Abstraction of generic SFH first and second floor plans as undirected graphs.
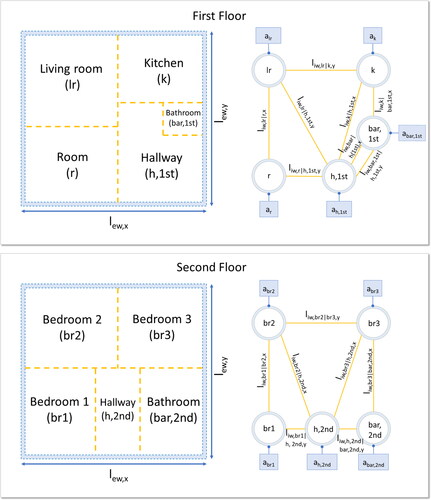
Fig. 4. Abstraction of generic SFH basement and attic floor plans as undirected graphs.
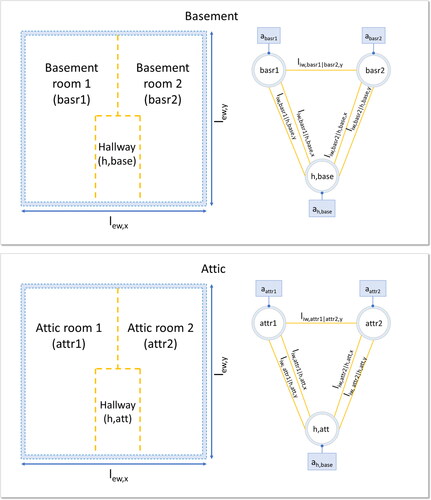
Fig. 5. Updated workflow of Teco including interior walls’ parametric solution space.
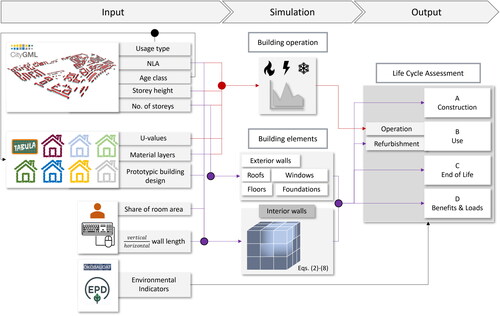
Table 3. Functional parameters for wall lengths and floor areas.
Fig. 6. Visual representation of the use case district using FZK viewer IAI/KIT (Citation2021).
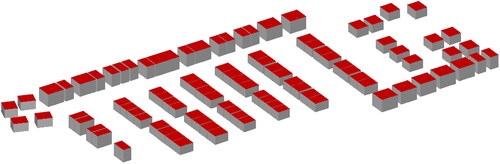
Table 4. Basic parameters of the district use case.
Fig. 7. Area (LCI) and GWP (LCIA) per building element in district from Teco and manual validation (Schildt et al. Citation2022).
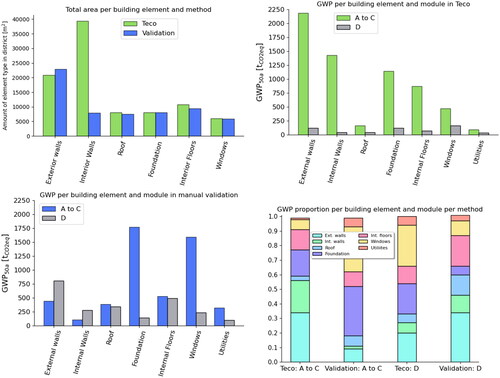
Fig. 8. Total interior wall area distribution by number of LHS sample.
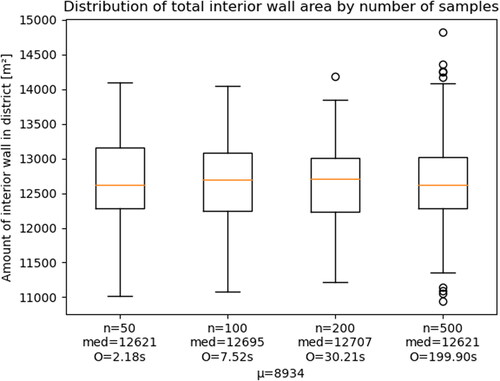
Fig. 9. Interior wall area distribution by building type and number of LHS samples.
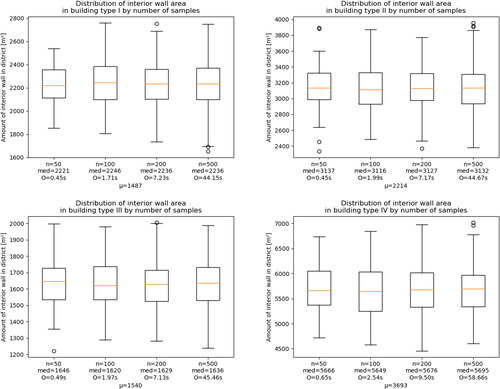
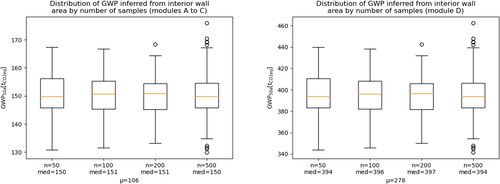
Fig. 10. Distribution of GWP inferred from interior wall area by modules and number of LHS samples with Teco’s material setup.
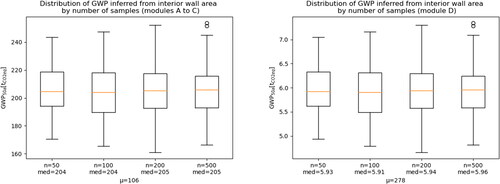
Fig. 11. Distribution of GWP inferred from interior wall area by modules and number of LHS samples with the actual material setup.