Figures & data
Figure 1. Level of democracy and level of perceived corruption. Sources: Transparency International (2010); Freedom House (2010); Polity (2010).
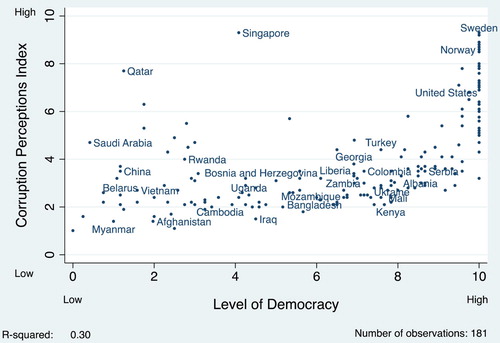
Figure 2. Level of democracy and human development index. Sources: UNDP (2010); Freedom House (2010); Polity (2010).
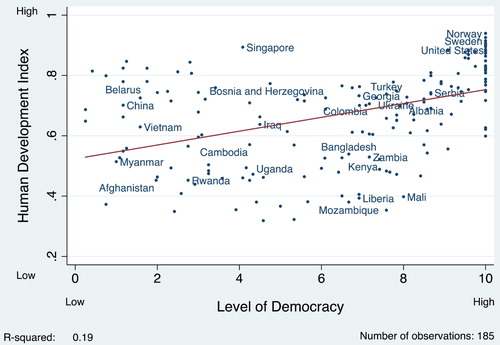
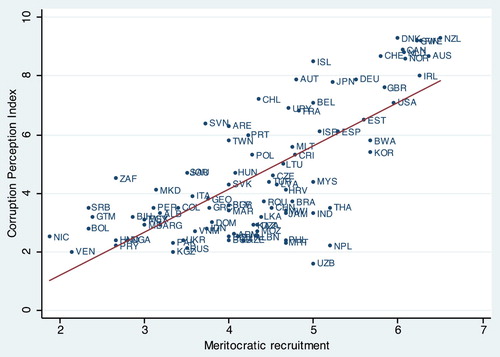
Figure 3. Meritocratic recruitment and corruption. Sources: Meritocratic recruitment is taken from the QoG Institute’s Expert Survey (Dahlström, Lapuente, & Teorell, Citation2012) and the measure of Corruption is from World Bank Control of Corruption Index 2010.