
Figures & data
© IOP Publishing. Reproduced with permission. All rights reserved. Source: Sanghoo Park, Wonho Choe, Holak Kim and Joo Young Park. Continuum emission-based electron diagnostics for atmospheric pressure plasmas and characteristics of nanosecond-pulsed argon plasma jets. Plasma Sources Science and Technology, 24(3), 034003. 29 April 2015. https://doi.org/10.1088/0963-0252/24/3/034003
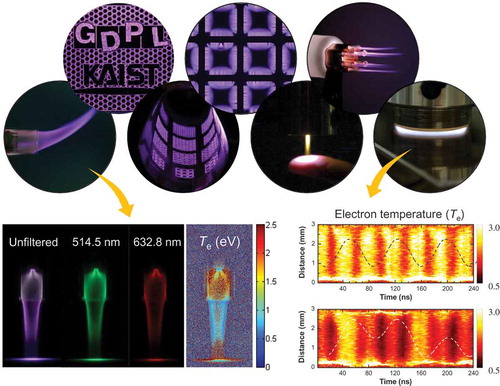
Figure 1. Remarkable results of atmospheric-pressure plasma research, from plasma diagnostics to applications [Citation17,Citation23,Citation24,Citation66,Citation84].
Adapted by permission of each publisher.
![Figure 1. Remarkable results of atmospheric-pressure plasma research, from plasma diagnostics to applications [Citation17,Citation23,Citation24,Citation66,Citation84].Adapted by permission of each publisher.](/cms/asset/18e30a3c-7b7e-44d5-b683-e10a81e0149a/tapx_a_1526114_f0001_oc.jpg)
Figure 2. Word network of PSST dataset. Nodes represent each word, and forced lines (called edges), which connect between words, indicate a similarity value (0–1 range) of words. Words that were detected more than 50 times in the whole dataset were selected and used in this graphic network, and only edges having a similarity value of > 0.85 are shown. Node and edge colors indicate a cluster affiliation based on modularity.

Table 1. Classification of plasmas in terms of operational conditions and electron characteristics.
Figure 3. Most popular and fascinating types of plasmas produced at atmospheric pressure (from the left in order): gliding arc ([Citation48], reproduced by permission of John Wiley and Sons), plasma jet ([Citation49], adapted by permission of John Wiley and Sons), dielectric barrier discharge (photographs represent a fabric-type source that is similar to the source provided in Refs. [Citation50,Citation51]), radio-frequency capacitive discharge, and microwave plasma torch ([Citation50], reproduced by permission of AIP Publishing).
![Figure 3. Most popular and fascinating types of plasmas produced at atmospheric pressure (from the left in order): gliding arc ([Citation48], reproduced by permission of John Wiley and Sons), plasma jet ([Citation49], adapted by permission of John Wiley and Sons), dielectric barrier discharge (photographs represent a fabric-type source that is similar to the source provided in Refs. [Citation50,Citation51]), radio-frequency capacitive discharge, and microwave plasma torch ([Citation50], reproduced by permission of AIP Publishing).](/cms/asset/c88cac56-5bcc-49ea-a5cb-6d1030f9747b/tapx_a_1526114_f0003_oc.jpg)
Figure 4. Characteristic time scale of the physical and chemical processes in high-pressure weakly ionized plasmas.
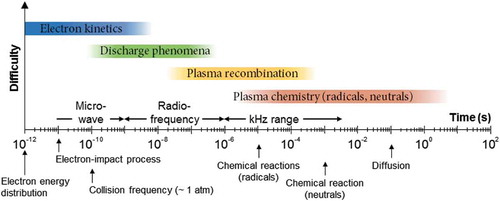
Table 2. Most feasible electron diagnostics for weakly ionized plasmas, particularly at atmospheric pressure [Citation130]. Adapted by permission of IOP publishing.
Figure 5. Optical emission spectroscopy results of rf capacitive discharges at atmospheric pressure [Citation177]. Raw optical emission spectra of (a) helium and (b) argon rf capacitive discharges in the spectral range of 250–850 nm. For these spectra, the plasma emission near the electrode (sheath edge), where the intensity of the atomic lines is the local maximum, was corrected and measured using a SpectraPro-750 monochromator with a slit width of 10 μm. A discontinuity occurs at 400 nm because the spectra in the wavelength range 400–850 nm were measured separately using a 400-nm long-pass filter to eliminate the second-order emission from 200–400 nm.
![Figure 5. Optical emission spectroscopy results of rf capacitive discharges at atmospheric pressure [Citation177]. Raw optical emission spectra of (a) helium and (b) argon rf capacitive discharges in the spectral range of 250–850 nm. For these spectra, the plasma emission near the electrode (sheath edge), where the intensity of the atomic lines is the local maximum, was corrected and measured using a SpectraPro-750 monochromator with a slit width of 10 μm. A discontinuity occurs at 400 nm because the spectra in the wavelength range 400–850 nm were measured separately using a 400-nm long-pass filter to eliminate the second-order emission from 200–400 nm.](/cms/asset/8e3f99f1-2ba6-4011-b0ea-2d89c64e2cde/tapx_a_1526114_f0005_b.gif)
Figure 6. Illustration of (a) electron-ion and (b) electron-neutral bremsstrahlung mechanisms.
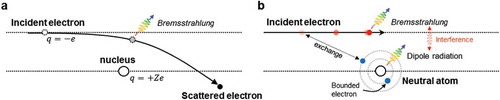
Figure 7. (a) Schematic of the experimental apparatus for an argon 13.56 MHz capacitive discharge and photographs of the unfiltered emission profile and the filtered emission profiles of 700.0 nm (corresponding Ar I), 514.5 nm, and 632.8 nm [Citation118]. Reproduced by permission of IOP Publishing. (b) Plasma apparatus for the argon nanosecond-pulsed plasma jet with the relevant power system, and optically unfiltered and filtered images taken using a DSLR camera with interference filters with center wavelengths of 514.5 nm, 632.8 nm, and 700 nm [Citation84]. Reproduced by permission of IOP Publishing.
![Figure 7. (a) Schematic of the experimental apparatus for an argon 13.56 MHz capacitive discharge and photographs of the unfiltered emission profile and the filtered emission profiles of 700.0 nm (corresponding Ar I), 514.5 nm, and 632.8 nm [Citation118]. Reproduced by permission of IOP Publishing. (b) Plasma apparatus for the argon nanosecond-pulsed plasma jet with the relevant power system, and optically unfiltered and filtered images taken using a DSLR camera with interference filters with center wavelengths of 514.5 nm, 632.8 nm, and 700 nm [Citation84]. Reproduced by permission of IOP Publishing.](/cms/asset/0aaee1db-d7ad-4475-b398-ed071d973fd0/tapx_a_1526114_f0007_oc.jpg)
Figure 8. Electron characteristics in various types of weakly ionized plasmas at atmospheric pressure [Citation76–Citation78,Citation80,Citation84,Citation119,Citation153–Citation157] and valid range of each diagnostic technique.
![Figure 8. Electron characteristics in various types of weakly ionized plasmas at atmospheric pressure [Citation76–Citation78,Citation80,Citation84,Citation119,Citation153–Citation157] and valid range of each diagnostic technique.](/cms/asset/c80ce247-b1d5-4204-b840-0d8818865821/tapx_a_1526114_f0008_oc.jpg)
Figure 9. Fraction of the neutral bremsstrahlung emissivity, , with (a) 3.0-eV Te at 300 nm, (b) 1.0-eV Te at 300 nm, and (c) 1.0-eV Te at 900 nm as a function of the gas pressure and electron density. The neutral bremsstrahlung-based electron diagnostic technique is valid under the conditions in the white region (
).
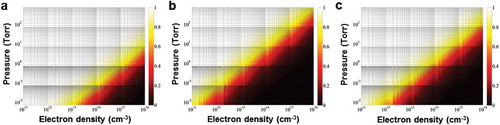
Table 3. Possible sources of continuum radiation in atmospheric-pressure plasmas. References are properly cited in the main text.
Figure 10. Measured spectra () of 13.56 MHz capacitive discharges with rf input power of 200 W in (a) helium and (b) argon [Citation84]. Reproduced by permission of IOP Publishing. The total emissivity
(=
+
) is denoted by the red curve, and the emissivities of the e – a bremsstrahlung (
) and the H2 continuum (
) are denoted by the blue and the green curves, respectively.
![Figure 10. Measured spectra (κm) of 13.56 MHz capacitive discharges with rf input power of 200 W in (a) helium and (b) argon [Citation84]. Reproduced by permission of IOP Publishing. The total emissivity κtotal (= κea + κH2) is denoted by the red curve, and the emissivities of the e – a bremsstrahlung (κea) and the H2 continuum (κH2) are denoted by the blue and the green curves, respectively.](/cms/asset/408be023-a308-4c23-bdd4-d743c2a40f99/tapx_a_1526114_f0010_oc.jpg)
Figure 11. (a) Normalized neutral bremsstrahlung emissivity with various Te from 1.0 eV to 3.0 eV and (b) electron temperature as a function of the emissivity ratio between two different wavelengths, 514.5 nm and 632.8 nm [Citation118]. (c) Argon plasma emission spectra measured by the calibrated spectrometer and relevant optical system [Citation118]. The absolute intensity of the plasma emission is indicated by black dots, and emissions that passed through interference filters with = 514.5 nm and 632.8 nm are indicated by the blue and red lines, respectively. (d) Intensity variations of a digital camera and a spectrometer at various rf input powers [Citation118]. Reproduced by permission of IOP Publishing.
![Figure 11. (a) Normalized neutral bremsstrahlung emissivity with various Te from 1.0 eV to 3.0 eV and (b) electron temperature as a function of the emissivity ratio between two different wavelengths, 514.5 nm and 632.8 nm [Citation118]. (c) Argon plasma emission spectra measured by the calibrated spectrometer and relevant optical system [Citation118]. The absolute intensity of the plasma emission is indicated by black dots, and emissions that passed through interference filters with λc = 514.5 nm and 632.8 nm are indicated by the blue and red lines, respectively. (d) Intensity variations of a digital camera and a spectrometer at various rf input powers [Citation118]. Reproduced by permission of IOP Publishing.](/cms/asset/2d14436b-30f9-428c-8968-60883de094df/tapx_a_1526114_f0011_oc.jpg)
Figure 12. Nanosecond-resolved visualization of the electron heating structure [Citation177]. Spatiotemporal evolution of 514.5-nm continuum radiation (left side) and Te (right side) at (a) 760 Torr, (b) 400 Torr, (c) 300 Torr, and (d) 200 Torr. The intensities of the continuum radiation are normalized by the maximum intensity, and the unit of Te is eV. Color bars are located on the right side of each image.
![Figure 12. Nanosecond-resolved visualization of the electron heating structure [Citation177]. Spatiotemporal evolution of 514.5-nm continuum radiation (left side) and Te (right side) at (a) 760 Torr, (b) 400 Torr, (c) 300 Torr, and (d) 200 Torr. The intensities of the continuum radiation are normalized by the maximum intensity, and the unit of Te is eV. Color bars are located on the right side of each image.](/cms/asset/a7b71d65-d8a6-469c-a0b4-7caa9d81de8a/tapx_a_1526114_f0012_oc.jpg)
Figure 13. Nanosecond-resolved visualization of electron heating [Citation119]. Spatiotemporal evolution of neutral bremsstrahlung at 514.5 nm measured in a (a) 4.52-MHz single-frequency discharge, (b) 13.56-MHz single-frequency discharge, and (c) dual-frequency discharge; and spatiotemporal evolution of Te in (d) 4.52-MHz single-frequency discharge, (e) 13.56-MHz single-frequency discharge, and (f) dual-frequency discharge. The dashed lines indicate the measured discharge voltage waveforms. The intensities of the continuum radiation are normalized by the maximum intensity, and the unit of Te is eV.
![Figure 13. Nanosecond-resolved visualization of electron heating [Citation119]. Spatiotemporal evolution of neutral bremsstrahlung at 514.5 nm measured in a (a) 4.52-MHz single-frequency discharge, (b) 13.56-MHz single-frequency discharge, and (c) dual-frequency discharge; and spatiotemporal evolution of Te in (d) 4.52-MHz single-frequency discharge, (e) 13.56-MHz single-frequency discharge, and (f) dual-frequency discharge. The dashed lines indicate the measured discharge voltage waveforms. The intensities of the continuum radiation are normalized by the maximum intensity, and the unit of Te is eV.](/cms/asset/c0a5eff4-0850-4454-a3f8-e5752edd32f3/tapx_a_1526114_f0013_oc.jpg)
Figure 14. (a) Cross-sectional schematic of eighth-generation industrial plasma chamber. The positions of the detector assemblies for tomographic OES are depicted as red rectangles on the chamber wall, and the lines of sights are depicted as blue lines. (b) Synthetic phantom for plasma emission with a hollow-squared structure and (c) its reconstruction test results. (d) Cross-sectional distribution of electron excitation temperature obtained from the intensity ratio of Ar I atomic lines at the wavelengths of 675.3 nm and 852.1 nm in unit eV [Citation191].
Adapted by permission of IOP Publishing.
![Figure 14. (a) Cross-sectional schematic of eighth-generation industrial plasma chamber. The positions of the detector assemblies for tomographic OES are depicted as red rectangles on the chamber wall, and the lines of sights are depicted as blue lines. (b) Synthetic phantom for plasma emission with a hollow-squared structure and (c) its reconstruction test results. (d) Cross-sectional distribution of electron excitation temperature obtained from the intensity ratio of Ar I atomic lines at the wavelengths of 675.3 nm and 852.1 nm in unit eV [Citation191].Adapted by permission of IOP Publishing.](/cms/asset/a8aa3162-6f42-4921-aac3-f0b909d45b7f/tapx_a_1526114_f0014_oc.jpg)
Figure 15. (a) Visualization of the continuous influence of plasma and catalyst on the gas conversion process [Citation192]. (b) Criteria for direct interaction between plasma and catalyst ([Citation193], reproduced by permission of Elsevier).
![Figure 15. (a) Visualization of the continuous influence of plasma and catalyst on the gas conversion process [Citation192]. (b) Criteria for direct interaction between plasma and catalyst ([Citation193], reproduced by permission of Elsevier).](/cms/asset/140ba4e6-dc61-4835-8bd6-722f7f11ca55/tapx_a_1526114_f0015_oc.jpg)
Figure 16. Comparison of direct and indirect plasma-liquid interactions; liquid is not part of the electric circuit in indirect interactions [Citation206]. Reproduced by permission of IOP Publishing.
![Figure 16. Comparison of direct and indirect plasma-liquid interactions; liquid is not part of the electric circuit in indirect interactions [Citation206]. Reproduced by permission of IOP Publishing.](/cms/asset/45da7596-a6f6-4785-a6cb-01956d0283f3/tapx_a_1526114_f0016_oc.jpg)