
Figures & data
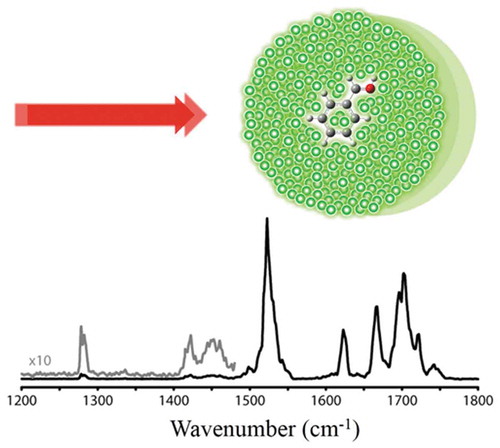
Figure 1. Schematic of a basic vacuum apparatus for spectroscopy in He droplets. The helium droplets are produced from a continuous nozzle (NZ) in the source chamber on the left which is pumped by 3000 L/s turbomolecular pump. The droplets pass through a skimmer (SK) before they enter the pickup chambers. The droplets terminate in the detection chamber which hosts an off-axis quadrupole mass spectrometer (QMS) with an electron ionization source. A gate valve (GV) separates the UHV detection chamber from the rest of the apparatus. The detection chamber has an on-axis optical window for laser input.
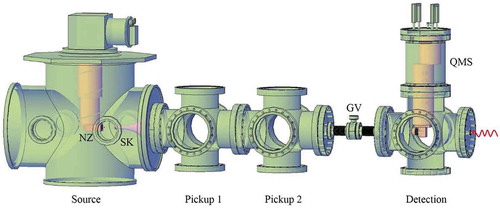
Figure 2. Schematic of infrared depletion spectroscopy. Upon absorption of a photon (ν =3000 cm−1) by the dopant in a droplet with ~6000 He atoms, and following vibrational relaxation, a few hundred helium atoms evaporate resulting in a reduced average size of the droplets (NHe ≈5400) in the beam. This ~10% decrease in NHe is seen as a dip in the mass spectrometer signal measuring He2+ ions.
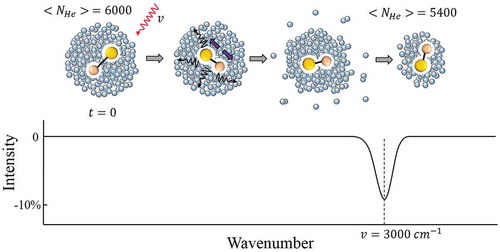
Figure 3. The spectrum of the v3 rotational – vibrational band of SF6 in a droplet with ~4000 helium atoms. The thin line represents a simulation of the spectra using a simplified free molecule rotational-vibrational Hamiltonian that includes the effects of centrifugal distortion and Coriolis coupling. The underlying stick spectrum shows the positions and intensities of the lines. The fit in terms of a more accurate spherical top Hamiltonian is presented in Ref. [Citation80]. This figure is used with permission from Ref. [Citation32].
![Figure 3. The spectrum of the v3 rotational – vibrational band of SF6 in a droplet with ~4000 helium atoms. The thin line represents a simulation of the spectra using a simplified free molecule rotational-vibrational Hamiltonian that includes the effects of centrifugal distortion and Coriolis coupling. The underlying stick spectrum shows the positions and intensities of the lines. The fit in terms of a more accurate spherical top Hamiltonian is presented in Ref. [Citation80]. This figure is used with permission from Ref. [Citation32].](/cms/asset/97f850a5-ce15-4406-a6a2-6e32cbfc22b7/tapx_a_1553569_f0003_b.gif)
Figure 4. A series of OCS infrared spectra of the ν3 vibrational mode in a pure 3He droplet and mixed 3He/4He droplets. Zero frequency corresponds to 2061.71 cm−1. The average number of 3He atoms is ~1.2 × 10⁴ while the average number of 4He atoms varies: 0 (a), 7 (b), 25 (c), 35 (d), 60 (e), and 100 (f). Adapted from Ref. [Citation33].
![Figure 4. A series of OCS infrared spectra of the ν3 vibrational mode in a pure 3He droplet and mixed 3He/4He droplets. Zero frequency corresponds to 2061.71 cm−1. The average number of 3He atoms is ~1.2 × 10⁴ while the average number of 4He atoms varies: 0 (a), 7 (b), 25 (c), 35 (d), 60 (e), and 100 (f). Adapted from Ref. [Citation33].](/cms/asset/b613be10-f44f-4dd5-91a7-11794196185f/tapx_a_1553569_f0004_b.gif)
Figure 5. Rotational constant B and shift of the ν1 band origin of OCS versus the number of added 4He atoms, NHe. Panel (a) shows the variation of the value of B with NHe, modified from Ref. [Citation92]. The plot incorporates experimental (red circles) [Citation92] and calculated values (black triangles [Citation99–Citation101], blue squares [Citation103], green squares [Citation102]). The black cross corresponds to measurements in mixed droplets containing 60 4He atoms in 3He clusters from (e) [Citation33]. The blue and black lines correspond to measurements in neat 4He and 3He droplets, respectively [Citation33,Citation91]. Note that in 3He, B = 1050 MHz is out of range. For comparison, in free OCS, B = 6087 MHz; also off scale. Panel (b) shows the shift of the vibrational band origin in OCS-HeN clusters vs NHe from Ref. [Citation104]. Black squares are experimental results from Ref. [Citation92]. The red circles are calculated using Morse/long-range (VMLR) potential [Citation104], the blue triangles are obtained from fourth order Moller-Plesset (VMP4) [Citation100], and the green diamonds are from GP potential calculations [Citation105]. Note: 1 cm−1 = 30 GHz. The blue and black lines correspond to measurements in neat 4He and 3He droplets, respectively [Citation33,Citation91].
![Figure 5. Rotational constant B and shift of the ν1 band origin of OCS versus the number of added 4He atoms, NHe. Panel (a) shows the variation of the value of B with NHe, modified from Ref. [Citation92]. The plot incorporates experimental (red circles) [Citation92] and calculated values (black triangles [Citation99–Citation101], blue squares [Citation103], green squares [Citation102]). The black cross corresponds to measurements in mixed droplets containing 60 4He atoms in 3He clusters from Figure 4(e) [Citation33]. The blue and black lines correspond to measurements in neat 4He and 3He droplets, respectively [Citation33,Citation91]. Note that in 3He, B = 1050 MHz is out of range. For comparison, in free OCS, B = 6087 MHz; also off scale. Panel (b) shows the shift of the vibrational band origin in OCS-HeN clusters vs NHe from Ref. [Citation104]. Black squares are experimental results from Ref. [Citation92]. The red circles are calculated using Morse/long-range (VMLR) potential [Citation104], the blue triangles are obtained from fourth order Moller-Plesset (VMP4) [Citation100], and the green diamonds are from GP potential calculations [Citation105]. Note: 1 cm−1 = 30 GHz. The blue and black lines correspond to measurements in neat 4He and 3He droplets, respectively [Citation33,Citation91].](/cms/asset/ccea1a98-5419-4632-9664-fd832baea7d2/tapx_a_1553569_f0005_oc.jpg)
Figure 6. Small water (a) and HCN (b) clusters obtained in He droplets in Refs. [Citation67] and [Citation62], respectively. Panel (c) shows the spectra of (NNH3)n clusters of different sizes in He droplets: NHe = 3.5 × 10³ (traces a and b). NHe = 1.2 × 10⁴ (trace c); NHe = 2.1 × 10⁴ (traces d and e); NHe = 2.5 × 10⁶ (traces f and g); and NHe = 1.4 × 10⁷ (trace h). The average number of ammonia molecules captured by the droplets is shown in each panel. Vertical solid lines at 3210, 3280, and 3374 cm−1 indicate the positions of the spectral maxima in the ammonia crystal, while the vertical dashed lines indicate the origins of the 2ν4(l = 0), 2ν4(l = 2), ν1, and ν3 bands of single ammonia molecules in He droplets at 3216.1, 3238.7, 3335.8, and 3443.1 cm−1, respectively. Adapted from Ref. [Citation74] with permission.
![Figure 6. Small water (a) and HCN (b) clusters obtained in He droplets in Refs. [Citation67] and [Citation62], respectively. Panel (c) shows the spectra of (NNH3)n clusters of different sizes in He droplets: NHe = 3.5 × 10³ (traces a and b). NHe = 1.2 × 10⁴ (trace c); NHe = 2.1 × 10⁴ (traces d and e); NHe = 2.5 × 10⁶ (traces f and g); and NHe = 1.4 × 10⁷ (trace h). The average number of ammonia molecules captured by the droplets is shown in each panel. Vertical solid lines at 3210, 3280, and 3374 cm−1 indicate the positions of the spectral maxima in the ammonia crystal, while the vertical dashed lines indicate the origins of the 2ν4(l = 0), 2ν4(l = 2), ν1, and ν3 bands of single ammonia molecules in He droplets at 3216.1, 3238.7, 3335.8, and 3443.1 cm−1, respectively. Adapted from Ref. [Citation74] with permission.](/cms/asset/e9581424-d88c-4126-b8cb-fe071835edfc/tapx_a_1553569_f0006_oc.jpg)
Figure 7. Infrared spectra of Ag – Et clusters in helium droplets consisting of ~105–106 atoms. The ν5(||), ν8+11(||), and ν7(┴) bands of Et are labelled. In (a), droplets were doped first with Ag followed by Et (Ag core-Et shell cluster as shown in the upper right pictogram). The depletion spectra are recorded upon capture of different number of ethane molecules in the downstream pickup cell. In (b), droplets were first doped with Et followed by Ag leading to the formation of Et core-Ag shell clusters as shown in the lower right pictogram. In both a) and b), the ν7 peak is split in two: I (interfacial) and V (volume). The frequency of three transitions in clusters (dotted line) is blue shifted compared to free molecule (dashed line) due to Ag–Et interactions. Adapted from Ref. [Citation133,Citation134].
![Figure 7. Infrared spectra of Ag – Et clusters in helium droplets consisting of ~105–106 atoms. The ν5(||), ν8+11(||), and ν7(┴) bands of Et are labelled. In (a), droplets were doped first with Ag followed by Et (Ag core-Et shell cluster as shown in the upper right pictogram). The depletion spectra are recorded upon capture of different number of ethane molecules in the downstream pickup cell. In (b), droplets were first doped with Et followed by Ag leading to the formation of Et core-Ag shell clusters as shown in the lower right pictogram. In both a) and b), the ν7 peak is split in two: I (interfacial) and V (volume). The frequency of three transitions in clusters (dotted line) is blue shifted compared to free molecule (dashed line) due to Ag–Et interactions. Adapted from Ref. [Citation133,Citation134].](/cms/asset/4489d50d-f888-4fbb-987c-db636016ab64/tapx_a_1553569_f0007_oc.jpg)
Figure 8. Shown in (a) are the infrared spectra in the range of 3020–3120 cm−1 of a single cyclopentadienyl radical (red trace), a dimer of cyclopentadienyl radicals (blue trace), and the precursor of cyclopentadiene (nickelocene, black trace). The radical spectra were recorded at an oven temperature of 900°C using mass channel m/z = 39, whereas the precursor spectrum was recorded at room temperature and m/z ≥ 8. Adapted from Ref. [Citation153]. Shown in (b) is the depletion spectrum of OH-CH4 complex measured at m/z = 19. Adapted from Ref. [Citation158].
![Figure 8. Shown in (a) are the infrared spectra in the range of 3020–3120 cm−1 of a single cyclopentadienyl radical (red trace), a dimer of cyclopentadienyl radicals (blue trace), and the precursor of cyclopentadiene (nickelocene, black trace). The radical spectra were recorded at an oven temperature of 900°C using mass channel m/z = 39, whereas the precursor spectrum was recorded at room temperature and m/z ≥ 8. Adapted from Ref. [Citation153]. Shown in (b) is the depletion spectrum of OH-CH4 complex measured at m/z = 19. Adapted from Ref. [Citation158].](/cms/asset/6e6e844d-0399-4cad-8346-67f789af2ef6/tapx_a_1553569_f0008_oc.jpg)
Figure 9. A 3D rendering of the VTMA experiment. The Grey slabs are the mirrors which reflect the laser (orange lines). Potential is applied to the plates (golden) placed perpendicular to the mirrors. After entering the cell, the randomly oriented dipoles align parallel to the field along z-direction.
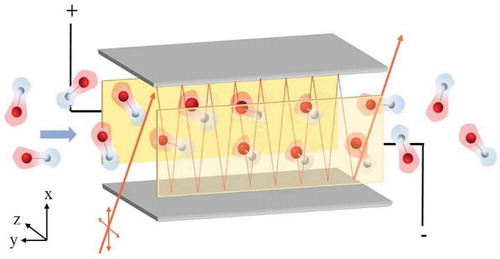
Figure 10. Stark spectroscopy in helium droplets. Shown is the spectrum of HCCCN in 4He droplets at different electric field potential (0–10 kV) [Citation60]. Alignment of molecular dipoles is shown in pictogram on the right. The spectra has been obtained and modified with permission from Ref. [Citation60].
![Figure 10. Stark spectroscopy in helium droplets. Shown is the spectrum of HCCCN in 4He droplets at different electric field potential (0–10 kV) [Citation60]. Alignment of molecular dipoles is shown in pictogram on the right. The spectra has been obtained and modified with permission from Ref. [Citation60].](/cms/asset/d2c1215e-a737-44dc-a64e-e80e2e2ab2b0/tapx_a_1553569_f0010_oc.jpg)
Figure 11. VTMA study of adenine [Citation180]. On top, a DC field aligns the permanent molecular dipole (Green solid line, μD) to the laboratory frame. A parallel laser field (ELaser ‖ EDC) rises the mode intensity for (Golden peak, μAS), while a perpendicular laser field (ELaser ┴ EDC) rises the mode intensity for
(Red peak, μNH, μSS). The dotted black trace represents the zero field peak. Bottom figure shows the intensity variation of (a) NH2 (Sym), (b) NH, (c) NH2 (Asym) stretches when laser polarization is parallel (top) and perpendicular (bottom) to the electric field. The middle spectrum was measured at zero field. Boxes (a) and (b) show enhanced intensity for perpendicular polarization while (c) shows raised intensity for parallel polarization.
![Figure 11. VTMA study of adenine [Citation180]. On top, a DC field aligns the permanent molecular dipole (Green solid line, μD) to the laboratory frame. A parallel laser field (ELaser ‖ EDC) rises the mode intensity for α<54.7∘ (Golden peak, μAS), while a perpendicular laser field (ELaser ┴ EDC) rises the mode intensity for α>54.7∘ (Red peak, μNH, μSS). The dotted black trace represents the zero field peak. Bottom figure shows the intensity variation of (a) NH2 (Sym), (b) NH, (c) NH2 (Asym) stretches when laser polarization is parallel (top) and perpendicular (bottom) to the electric field. The middle spectrum was measured at zero field. Boxes (a) and (b) show enhanced intensity for perpendicular polarization while (c) shows raised intensity for parallel polarization.](/cms/asset/4bbda4fd-1c11-4cf2-b306-276bd1dad12b/tapx_a_1553569_f0011_oc.jpg)
Figure 12. Spectra of aniline ions in helium droplets (Left) [Citation194]. The top left panel shows spectrum in the frequency range of NH stretching and NH2 scissoring modes, along with a magnified spectra of the two bands. The bottom panel shows the spectrum in the frequency range of the overtones. The pictogram on the right illustrates the ion ejection spectroscopy. Embedded aniline ions are produced via laser resonance multiphoton ionization. The resulting ions absorb several quanta of IR leading to the ejection of bare ions.
![Figure 12. Spectra of aniline ions in helium droplets (Left) [Citation194]. The top left panel shows spectrum in the frequency range of NH stretching and NH2 scissoring modes, along with a magnified spectra of the two bands. The bottom panel shows the spectrum in the frequency range of the overtones. The pictogram on the right illustrates the ion ejection spectroscopy. Embedded aniline ions are produced via laser resonance multiphoton ionization. The resulting ions absorb several quanta of IR leading to the ejection of bare ions.](/cms/asset/6224e5af-b785-42a3-afd3-4c33ef82215b/tapx_a_1553569_f0012_oc.jpg)
Figure 13. IR spectrum of Leu-Enk in He droplets showing C-O and N-H stretches and N-H bend from containing aminoacids [Citation198].
![Figure 13. IR spectrum of Leu-Enk in He droplets showing C-O and N-H stretches and N-H bend from containing aminoacids [Citation198].](/cms/asset/67c4aede-f520-4770-9950-68a68b5f3b1b/tapx_a_1553569_f0013_oc.jpg)