
Figures & data
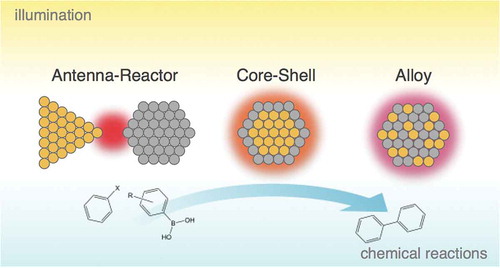
Figure 1. Intermetallic optical and catalytic effects in bimetallic nanostructures. (a) Schematic representations of the three bimetallic geometries in this paper: antenna–reactor, core-shell, and alloyed nanoparticles, with the gold color representing a plasmonic metal and the grey color representing a catalytic metal. (b) Calculated extinction cross section of the sum of a 24 nm × 96 nm Au nanorod and a 2 nm Pd shell (black) versus a Au@Pd core-shell nanorod (red) with the same dimensions. Calculated using the boundary element method with plane wave excitation [Citation119]. (c) The yield of the Suzuki coupling reaction between bromobenzene and m-tolylboronic acid under illumination using either Au@Pd nanorod catalysts (red) or a mixture of Au nanorods and porous Pd nanoparticles (black) with the same metal molarity ratio. (c) Adapted with permission from [Citation24]. Copyright 2013 American Chemical Society.
![Figure 1. Intermetallic optical and catalytic effects in bimetallic nanostructures. (a) Schematic representations of the three bimetallic geometries in this paper: antenna–reactor, core-shell, and alloyed nanoparticles, with the gold color representing a plasmonic metal and the grey color representing a catalytic metal. (b) Calculated extinction cross section of the sum of a 24 nm × 96 nm Au nanorod and a 2 nm Pd shell (black) versus a Au@Pd core-shell nanorod (red) with the same dimensions. Calculated using the boundary element method with plane wave excitation [Citation119]. (c) The yield of the Suzuki coupling reaction between bromobenzene and m-tolylboronic acid under illumination using either Au@Pd nanorod catalysts (red) or a mixture of Au nanorods and porous Pd nanoparticles (black) with the same metal molarity ratio. (c) Adapted with permission from [Citation24]. Copyright 2013 American Chemical Society.](/cms/asset/a2bdad59-6056-404c-8421-4b2c89f17d1d/tapx_a_1619480_f0001_oc.jpg)
Figure 2. Electronic properties of plasmonic and catalytic metals. (a,b) Electronic band structure of typical plasmonic metals (a) and catalytic metals (b). To the right of each diagram is the density of states of a simple molecular adsorbate. (c) Computed extinction cross sections of a 20 nm nanoparticle in water for various metals. The optical response of Ag was multiplied by 0.2 to fit on the same graph. Simulated using the boundary element method under plane wave excitation [Citation119]. (d) Volcano plot of the hydrogen evolution reaction for various metal electrodes in acidic media. The metals plotted in (c) are denoted by red dots. (a,b) Adapted by permission from Nature Publishing Group [Citation21]. Copyright 2018. Adapted from [Citation34] with permission from Elsevier. (d) Adapted with permission from [Citation38]. Copyright 2010 American Chemical Society.
![Figure 2. Electronic properties of plasmonic and catalytic metals. (a,b) Electronic band structure of typical plasmonic metals (a) and catalytic metals (b). To the right of each diagram is the density of states of a simple molecular adsorbate. (c) Computed extinction cross sections of a 20 nm nanoparticle in water for various metals. The optical response of Ag was multiplied by 0.2 to fit on the same graph. Simulated using the boundary element method under plane wave excitation [Citation119]. (d) Volcano plot of the hydrogen evolution reaction for various metal electrodes in acidic media. The metals plotted in (c) are denoted by red dots. (a,b) Adapted by permission from Nature Publishing Group [Citation21]. Copyright 2018. Adapted from [Citation34] with permission from Elsevier. (d) Adapted with permission from [Citation38]. Copyright 2010 American Chemical Society.](/cms/asset/29135cfb-25dc-4d81-b282-0da4ce6a368e/tapx_a_1619480_f0002_oc.jpg)
Figure 3. Optical and catalytic response of antenna–reactor systems (a) Schematic of an antenna–reactor system with an Al nanodisk antenna and nearby Pd nanodisk reactor. (b) SEM of the Al-Pd antenna–reactor system created via hole-mask lithography. Scale bar is 200 nm. (c) (left) Measured performance on hydrogen dissociation (measured via HD generation) for different illumination wavelengths and polarizations (filled vs open circles). (right) Computed absorption in the Pd nanodisk at various illumination wavelengths. The hydrogen dissociation rate follows the spectral response. (d) Transmission electron microscope (TEM) image of an another antenna–reactor geometry that combines a lithographically patterned Au nanodisk antenna with a nearby colloidally synthesized Pd nanocube reactor. (e) Computed electric field enhancement for an antenna–reactor system under plane wave excitation at 690 nm and the spatial distribution of the phase transition nucleation corner across 35 phase transformations, with 1 indicating the closest corner to the antenna and 4 indicating the furthest. (f) Schematic and TEM image of a colloidally synthesized antenna–reactor system with a 50 nm Ag spherical core, surrounded by an 8–10 nm SiO2 spacer shell, and decorated with Pt reactor nanoparticles. (g) Photocatalytic rate of CO oxidation over Ag@SiO2/Pt photocatalysts compared across Ag antennas of different sizes. The maximal photocatalytic rate is when both the field enhancement (turquoise circles) and fraction of photons absorbed (purple crosses) are simultaneously maximized. (a-c) Adapted with permission from [Citation25]. Copyright 2016 American Chemical Society. (d,e) Adapted with permission from [Citation27]. Copyright 2018 Nature Publishing Group. (f,g) Adapted with permission from [Citation47]. Copyright 2017 American Chemical Society.
![Figure 3. Optical and catalytic response of antenna–reactor systems (a) Schematic of an antenna–reactor system with an Al nanodisk antenna and nearby Pd nanodisk reactor. (b) SEM of the Al-Pd antenna–reactor system created via hole-mask lithography. Scale bar is 200 nm. (c) (left) Measured performance on hydrogen dissociation (measured via HD generation) for different illumination wavelengths and polarizations (filled vs open circles). (right) Computed absorption in the Pd nanodisk at various illumination wavelengths. The hydrogen dissociation rate follows the spectral response. (d) Transmission electron microscope (TEM) image of an another antenna–reactor geometry that combines a lithographically patterned Au nanodisk antenna with a nearby colloidally synthesized Pd nanocube reactor. (e) Computed electric field enhancement for an antenna–reactor system under plane wave excitation at 690 nm and the spatial distribution of the phase transition nucleation corner across 35 phase transformations, with 1 indicating the closest corner to the antenna and 4 indicating the furthest. (f) Schematic and TEM image of a colloidally synthesized antenna–reactor system with a 50 nm Ag spherical core, surrounded by an 8–10 nm SiO2 spacer shell, and decorated with Pt reactor nanoparticles. (g) Photocatalytic rate of CO oxidation over Ag@SiO2/Pt photocatalysts compared across Ag antennas of different sizes. The maximal photocatalytic rate is when both the field enhancement (turquoise circles) and fraction of photons absorbed (purple crosses) are simultaneously maximized. (a-c) Adapted with permission from [Citation25]. Copyright 2016 American Chemical Society. (d,e) Adapted with permission from [Citation27]. Copyright 2018 Nature Publishing Group. (f,g) Adapted with permission from [Citation47]. Copyright 2017 American Chemical Society.](/cms/asset/bd5e1779-308f-4fab-9c27-3ee0ec4cdfb7/tapx_a_1619480_f0003_oc.jpg)
Figure 4. Computational and Experimental Measurements of the Optical Properties of Core-Shell Nanoparticles. (a,b) The relative contribution of the core versus shell in computed absorption cross sections of (a) pure Ag nanocubes and (b) Ag@Pt nanocubes. The core is 40 nm and the shell is 1.4 nm in both cases. (c,d) The relative contribution of the shell in the computed absorption cross section for a Au@Pt nanorod under (c) transverse and (d) longitudinal plane wave excitation, corresponding to exciting (c) interband and (d) intraband transitions. (e,f) Single particle scattering and absorption measurements of (e) two Au nanorods and (f) two Au@Pt nanorods. Dimensions of the nanorods given in the top right corner of the absorption spectra. TEMs of the Au@Pt nanorods show dendritic Pt islands rather than a continuous shell, as reflected by the schematics. (a-d) Adapted with permission from [Citation76]. Copyright 2018 American Chemical Society; (e,f) Adapted with permission from [Citation77]. Copyright 2018 American Chemical Society.
![Figure 4. Computational and Experimental Measurements of the Optical Properties of Core-Shell Nanoparticles. (a,b) The relative contribution of the core versus shell in computed absorption cross sections of (a) pure Ag nanocubes and (b) Ag@Pt nanocubes. The core is 40 nm and the shell is 1.4 nm in both cases. (c,d) The relative contribution of the shell in the computed absorption cross section for a Au@Pt nanorod under (c) transverse and (d) longitudinal plane wave excitation, corresponding to exciting (c) interband and (d) intraband transitions. (e,f) Single particle scattering and absorption measurements of (e) two Au nanorods and (f) two Au@Pt nanorods. Dimensions of the nanorods given in the top right corner of the absorption spectra. TEMs of the Au@Pt nanorods show dendritic Pt islands rather than a continuous shell, as reflected by the schematics. (a-d) Adapted with permission from [Citation76]. Copyright 2018 American Chemical Society; (e,f) Adapted with permission from [Citation77]. Copyright 2018 American Chemical Society.](/cms/asset/910ed718-a594-468c-9fc1-a2697fc91dbb/tapx_a_1619480_f0004_oc.jpg)
Figure 5. Increased plasmon catalysis upon partial shelling. (a) TEM images of Au triangular nanoprisms (TNP) with edge lengths of 141 nm shelled with Pt at either the edges (red), tips (blue), or all over (pink). (b) The overall H2 generation over the three core-shell particles under visible-NIR light irradiation (>420 nm). (c) The measured extinction spectra of the three geometries. (d) The H2 generation rate (from (b)) normalized by the amount of Pt on each geometry. (e) TEM image of a Au@Pd superstructure. (f) The measured hot electron generation and computed maximum electric field enhancement across pure Au nanorods and three different shell geometries (superstructure, nanodendrites, and continuous core-shell). (g) The turnover frequency of a Suzuki-coupling reaction for various nanoparticle geometries and mixtures under dark and illumination conditions. (a-d) Adapted with permission from [Citation80]. Copyright 2016 American Chemical Society; (e-g) Adapted with permission from [Citation22]. Copyright 2017 American Chemical Society.
![Figure 5. Increased plasmon catalysis upon partial shelling. (a) TEM images of Au triangular nanoprisms (TNP) with edge lengths of 141 nm shelled with Pt at either the edges (red), tips (blue), or all over (pink). (b) The overall H2 generation over the three core-shell particles under visible-NIR light irradiation (>420 nm). (c) The measured extinction spectra of the three geometries. (d) The H2 generation rate (from (b)) normalized by the amount of Pt on each geometry. (e) TEM image of a Au@Pd superstructure. (f) The measured hot electron generation and computed maximum electric field enhancement across pure Au nanorods and three different shell geometries (superstructure, nanodendrites, and continuous core-shell). (g) The turnover frequency of a Suzuki-coupling reaction for various nanoparticle geometries and mixtures under dark and illumination conditions. (a-d) Adapted with permission from [Citation80]. Copyright 2016 American Chemical Society; (e-g) Adapted with permission from [Citation22]. Copyright 2017 American Chemical Society.](/cms/asset/5233411c-8686-449f-9ee3-030e33b2deb2/tapx_a_1619480_f0005_oc.jpg)
Figure 6. Plasmonic and catalytic properties of alloyed nanoparticles (a) Schematic of fabricating alloyed AuPd nanodisks by annealing deposited metal layers. (b) Experimentally measured plasmon peak location (left, dark blue) and plasmon linewidth (right, light blue) as a function of Au content percentage for alloyed AuPd nanodisks. (c) The reaction conversion percentage for three different reactions (Suzuki-Miyaura cross-coupling, benzylamine oxidation, and benzyl alcohol oxidation) over different AuPd alloys under dark (left) and illumination (400-800 nm) (right) conditions. Molar Au:Pd ratio is given above the data points in the dark condition graph. (d) TEM image of a cubic AgPt nanocage. (e) Hydrogen peroxide byproduct formation under chopped illumination for Ag nanocages compared to an AgPt alloy. Notably, the alloy shows a more pronounced decrease in hydrogen peroxide upon illumination. (f) Change in x-ray absorption near edge structure spectroscopy of various Ag:Pt concentrations under dark (black) and illumination (colored) conditions. The relative change in absorption corresponds to the change in number of vacancies in the Pt5d orbital. The schematic on the right shows the proposed mechanism – plasmonically excited hot electrons filling the Pt5d orbital. (a) Adapted with permission from [Citation95]. Copyright 2015 American Chemical Society; (b) Adapted with permission from [Citation92]. Copyright 2016 American Chemical Society; (c) Adapted with permission from [Citation19]. Copyright 2013 American Chemical Society; (d-f) Adapted with permission from [Citation29]. Copyright 2017 American Chemical Society.
![Figure 6. Plasmonic and catalytic properties of alloyed nanoparticles (a) Schematic of fabricating alloyed AuPd nanodisks by annealing deposited metal layers. (b) Experimentally measured plasmon peak location (left, dark blue) and plasmon linewidth (right, light blue) as a function of Au content percentage for alloyed AuPd nanodisks. (c) The reaction conversion percentage for three different reactions (Suzuki-Miyaura cross-coupling, benzylamine oxidation, and benzyl alcohol oxidation) over different AuPd alloys under dark (left) and illumination (400-800 nm) (right) conditions. Molar Au:Pd ratio is given above the data points in the dark condition graph. (d) TEM image of a cubic AgPt nanocage. (e) Hydrogen peroxide byproduct formation under chopped illumination for Ag nanocages compared to an AgPt alloy. Notably, the alloy shows a more pronounced decrease in hydrogen peroxide upon illumination. (f) Change in x-ray absorption near edge structure spectroscopy of various Ag:Pt concentrations under dark (black) and illumination (colored) conditions. The relative change in absorption corresponds to the change in number of vacancies in the Pt5d orbital. The schematic on the right shows the proposed mechanism – plasmonically excited hot electrons filling the Pt5d orbital. (a) Adapted with permission from [Citation95]. Copyright 2015 American Chemical Society; (b) Adapted with permission from [Citation92]. Copyright 2016 American Chemical Society; (c) Adapted with permission from [Citation19]. Copyright 2013 American Chemical Society; (d-f) Adapted with permission from [Citation29]. Copyright 2017 American Chemical Society.](/cms/asset/d9cfc794-63fa-476b-a4f1-8bc6b7062110/tapx_a_1619480_f0006_oc.jpg)