Figures & data

Figure 1. Mean density of exoplanets with radius and mass determination. Dashed lines indicate theoretical predictions for a purely iron, MgSiO and H
O composition. Planets of most interest for habitability are situated between those lines. At the high radius end of the figure are the gas giant planets. Intermediate between the smaller planets considered here to be those with a radius
is a group of planets with density decreasing with increasing radius and increasing amount of H-He envelope. Also indicated are the eight planets of the Solar System. Colours indicate the data source given for mass and radius. ‘R.V.’: radial velocity method, ‘Transit’: transit method, ‘TTV’: transit timing variations, ‘Theo.’: theoretical predictions.
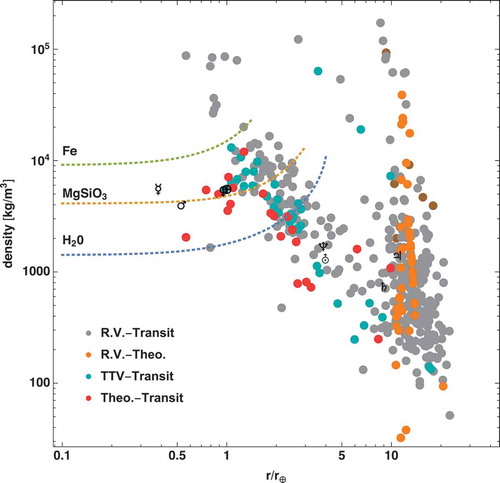
Figure 2. Schematic representation of some plausible but non-exhaustive interior structures of exoplanets with radius up to 2 Earth radii. Atmospheres are not indicated.
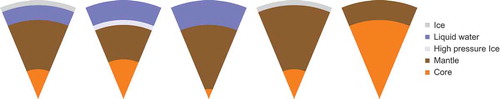
Figure 3. Density (top) and pressure (bottom) profiles of super-Earth exoplanets and water-rich planets with masses equal to 1 (dashed), 3 (dotted) and 5 (continuous) Earth masses. The super-Earths have a bulk iron wt% of 35 (Earth-like), 5 (Moon-like) and 63 (Mercury-like), a silicate magnesium number of 0.9 and no HO. For the water-rich planets, bulk H
O wt% of 50, 20 and 5 are considered. The 50 wt% H
O planets have 17.5 wt% iron and 32.5 wt% rocks (Mg number of 0.9), those with 20 wt% H
O have 28 wt% iron and 52 wt% rocks (Mg number of 0.9), and planets with 5 wt% H
O planets have 32.25 wt% iron and 61.75 wt% rocks (Mg number of 0.9).
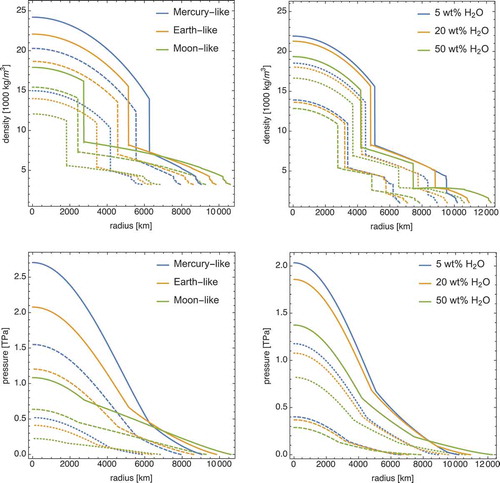
Figure 4. Mass-radius relation for exoplanets with mass smaller than or equal to 10 Earth masses. Three end-member compositions are considered: pure iron, MgSiO and H
O. Error bars are indicated for planets with errors
25%. Temperature effects have been neglected [e.g. Citation47,Citation50].
![Figure 4. Mass-radius relation for exoplanets with mass smaller than or equal to 10 Earth masses. Three end-member compositions are considered: pure iron, MgSiO3 and H 2O. Error bars are indicated for planets with errors <25%. Temperature effects have been neglected [e.g. Citation47,Citation50].](/cms/asset/486742f4-874e-48be-b2d6-d7de27163dac/tapx_a_1630316_f0004_oc.jpg)
Figure 5. Phase diagram for MgSiO at planetary pressure and temperature conditions based on [Citation96] for low pressures and on Umemoto:2017aa for higher pressures. The stability domains of the different minerals are indicated in colour.
![Figure 5. Phase diagram for MgSiO 3 at planetary pressure and temperature conditions based on [Citation96] for low pressures and on Umemoto:2017aa for higher pressures. The stability domains of the different minerals are indicated in colour.](/cms/asset/4e9f7bd1-0415-492e-8b24-8b2d1d5e33b5/tapx_a_1630316_f0005_oc.jpg)
Figure 6. Phase diagram for HO at planetary pressure and temperature conditions based on [Citation97]. The inset shows a zoom-in for pressures below 1 GPa.
![Figure 6. Phase diagram for H 2O at planetary pressure and temperature conditions based on [Citation97]. The inset shows a zoom-in for pressures below 1 GPa.](/cms/asset/40ee0288-492f-462f-86b1-a252fad0a8f6/tapx_a_1630316_f0006_oc.jpg)
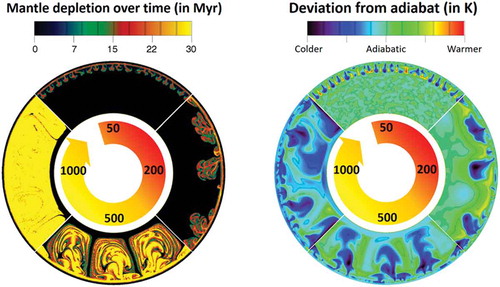
Figure 7. Mantle depletion and temperature evolution of the silicate mantle of a rocky exoplanet with a mass equal to that of the Earth and an iron bulk concentration of 35 wt% at four different times after formation: 50 Myr, 200 Myr, 500 Myr and 1 Gyr. The mantle becomes depleted due to partial melting and convective mixing. Its value is indicated as percent of extracted melt (between 0 and 30).