
Figures & data
Figure 1. Schematic comparison of linear regression, two-layer ANN, and GPR for the local energy prediction task. The symbols in the figure mirror the ones used in the main text. All three algorithms have been depicted in a similar manner so to ease the recognition of parallelisms and differences between the methods. Gaussian processes can be imagined to be equivalent to a fully connected ANN with a single infinite layer, this analogy has been proven rigorously in Refs. Neal [Citation77] and Rasmussen [Citation78].
![Figure 1. Schematic comparison of linear regression, two-layer ANN, and GPR for the local energy prediction task. The symbols in the figure mirror the ones used in the main text. All three algorithms have been depicted in a similar manner so to ease the recognition of parallelisms and differences between the methods. Gaussian processes can be imagined to be equivalent to a fully connected ANN with a single infinite layer, this analogy has been proven rigorously in Refs. Neal [Citation77] and Rasmussen [Citation78].](/cms/asset/4a171ff8-8f9f-4769-b14f-e7caeef2500c/tapx_a_1654919_f0001_oc.jpg)
Figure 2. Mean absolute error on the DFT force vector incurred by a three-body GPR algorithm trained on five isomers of Ni and tested on the defected double icosahedron (dDIH) isomer. Figure adapted with permission from Zeni et al.[Citation54].
![Figure 2. Mean absolute error on the DFT force vector incurred by a three-body GPR algorithm trained on five isomers of Ni 19 and tested on the defected double icosahedron (dDIH) isomer. Figure adapted with permission from Zeni et al.[Citation54].](/cms/asset/1cf6b21f-b26d-47cd-874f-57f80ef474af/tapx_a_1654919_f0002_oc.jpg)
Figure 3. Mean absolute errors on the binding energies of O; the RhAu
single crystals and particles are predicted using DFT data of single-crystal surfaces, small clusters, or both; using cutoff radii of (a) 6 and (b) 8 Å. Figure reprinted with permission from Jinnouchi and Asahi [Citation79] . Copyright (2017) American Chemical Society.
![Figure 3. Mean absolute errors on the binding energies of O; the Rh 1−xAu x single crystals and particles are predicted using DFT data of single-crystal surfaces, small clusters, or both; using cutoff radii of (a) 6 and (b) 8 Å. Figure reprinted with permission from Jinnouchi and Asahi [Citation79] . Copyright (2017) American Chemical Society.](/cms/asset/0c0a5cf0-f09d-497d-b94b-f36c4485f6be/tapx_a_1654919_f0003_b.gif)
Figure 4. Log mean absolute error on force vectors incurred by a two-body (left) and a three-body (right) GPR algorithm as a function of the log number of training points when trained and tested on a total database of (PtCu)
local atomic environments, with
= 13,000. The training points have been selected according to the three algorithms described above, and also with random sampling. The black-dashed line indicates an estimate of the convergence error, obtained by training the algorithm on 2000 randomly selected training points. The error bars display the standard deviation of the error, obtained by repeating the process five times.
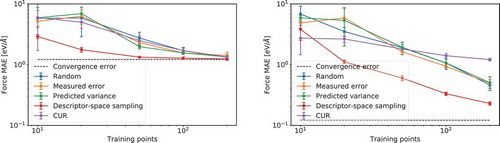
Figure 5. (a), (b), (c) Relative energies (eV) of the 20 PtH
isomers in the low energy metastable ensemble (zero represents the energy of the global minimum) and structures of the three most stable ones. Grey spheres indicate Pt atoms while red ones indicate H atoms. (d) Thermodynamics stability of Pt
H
clusters (x = 0, 18, 26) as a function of temperature and hydrogen pressure. Figure adapted with permission from Sun and Sautet [Citation68] . Copyright (2018) American Chemical Society.
![Figure 5. (a), (b), (c) Relative energies (eV) of the 20 Pt 13H 18 isomers in the low energy metastable ensemble (zero represents the energy of the global minimum) and structures of the three most stable ones. Grey spheres indicate Pt atoms while red ones indicate H atoms. (d) Thermodynamics stability of Pt 13Hx clusters (x = 0, 18, 26) as a function of temperature and hydrogen pressure. Figure adapted with permission from Sun and Sautet [Citation68] . Copyright (2018) American Chemical Society.](/cms/asset/1d7a1340-9ffb-4f41-8d85-04ea35ab950d/tapx_a_1654919_f0005_oc.jpg)
Figure 6. (a) The atomistic model of a PtAg
nanoparticle supported on a Pt(111). Ag and Pt atoms colored green and blue, respectively, the slab Pt atoms are white. (b) (c) The success rate of locating the global minimum as a function of the number of candidates evaluated and the number of needed parent calculations, respectively. (d) Graph highlighting the significant reduction in the average parent calculations needed. Figure reprinted with permission from Kolsbjerg, Peterson, and Hammer [Citation67] . Copyright 2018 by the American Physical Society.
![Figure 6. (a) The atomistic model of a Pt 3Ag 3 nanoparticle supported on a Pt(111). Ag and Pt atoms colored green and blue, respectively, the slab Pt atoms are white. (b) (c) The success rate of locating the global minimum as a function of the number of candidates evaluated and the number of needed parent calculations, respectively. (d) Graph highlighting the significant reduction in the average parent calculations needed. Figure reprinted with permission from Kolsbjerg, Peterson, and Hammer [Citation67] . Copyright 2018 by the American Physical Society.](/cms/asset/6fafeef6-dba6-42a4-803c-78ff696fcd8b/tapx_a_1654919_f0006_oc.jpg)
Figure 7. (a) Excess energy of a (PtAu) nanoparticle as a function of its chemical composition, located with an ML-accelerated genetic algorithm employing effective-medium theory calculations. (b) Number of energy calculations as a function of the nanoparticle’s composition. The four lines correspond to traditional genetic algorithms (GA), machine learning accelerated GA (MLaGA), serialized MLaGA and MLaGA utilizing uncertainty (uMLaGA); average and standard deviation over five searches are shown. Figure reprinted with permission from Jennings et al.[Citation89].
![Figure 7. (a) Excess energy of a (PtAu) 147 nanoparticle as a function of its chemical composition, located with an ML-accelerated genetic algorithm employing effective-medium theory calculations. (b) Number of energy calculations as a function of the nanoparticle’s composition. The four lines correspond to traditional genetic algorithms (GA), machine learning accelerated GA (MLaGA), serialized MLaGA and MLaGA utilizing uncertainty (uMLaGA); average and standard deviation over five searches are shown. Figure reprinted with permission from Jennings et al.[Citation89].](/cms/asset/91d9e4b4-3161-4869-ad50-5f66e16a17cb/tapx_a_1654919_f0007_oc.jpg)
Figure 8. (a) Scheme used for training and use of the model. New training data is acquired via DFT single-point calculations. (b) Scatter plot for three iterations of the convergence system, starting from very poor predictions and converging to more accurate predictions of adsorption energy. (c) Convergence of the accuracy of the CO adsorption energies with respect to the training set size. Points possess some inherent noise due to the stochastic nature of the neural network training algorithms. Figure adapted with permission from Ulissi et al. [64]. Copyright (2017) American Chemical Society.
![Figure 8. (a) Scheme used for training and use of the model. New training data is acquired via DFT single-point calculations. (b) Scatter plot for three iterations of the convergence system, starting from very poor predictions and converging to more accurate predictions of adsorption energy. (c) Convergence of the accuracy of the CO adsorption energies with respect to the training set size. Points possess some inherent noise due to the stochastic nature of the neural network training algorithms. Figure adapted with permission from Ulissi et al. [64]. Copyright (2017) American Chemical Society.](/cms/asset/5436a8ca-a55d-4e32-ac8b-2761fb216714/tapx_a_1654919_f0008_oc.jpg)
Figure 9. (a) Bottom-view of a snapshot of an MD simulation at 1000 K of a Cu cluster at the ZnO(1010) surface; five copper atoms have been selected to compare the ANN-predicted forces with the DFT forces (in d). (b) Side view of the cluster. (c) A top view of the ZnO(1010) surface is shown. Five oxygen and five zinc atoms have been chosen for a closer investigation of the forces (in (d)). (d) Comparison of the force modulus of two DFT force evaluations using atoms within 6 Å and 9 Å from the central one, and the neural network force field on the whole slab for the atoms highlighted in (a) and (c). Figure adapted with permission from Artrith, Hiller, and Behler [Citation59] . Copyright 2013 WILEY-VCH Verlag GmbH & Co. KGaA, Weinheim.
![Figure 9. (a) Bottom-view of a snapshot of an MD simulation at 1000 K of a Cu 612 cluster at the ZnO(1010) surface; five copper atoms have been selected to compare the ANN-predicted forces with the DFT forces (in d). (b) Side view of the cluster. (c) A top view of the ZnO(1010) surface is shown. Five oxygen and five zinc atoms have been chosen for a closer investigation of the forces (in (d)). (d) Comparison of the force modulus of two DFT force evaluations using atoms within 6 Å and 9 Å from the central one, and the neural network force field on the whole slab for the atoms highlighted in (a) and (c). Figure adapted with permission from Artrith, Hiller, and Behler [Citation59] . Copyright 2013 WILEY-VCH Verlag GmbH & Co. KGaA, Weinheim.](/cms/asset/c6d642f4-f11c-48de-9016-9133e47fde49/tapx_a_1654919_f0009_oc.jpg)
Figure 10. (a) Geometry of an Au icosahedron. (b) Geometry of the putative ground minimum for Au
found using an ANN force field. Figure (b) is colour coded so to highlight the three shells of Au atoms. Figure reprinted from Jindal, Chiriki, and Bulusu [Citation71], with the permission of AIP Publishing.
![Figure 10. (a) Geometry of an Au 147 icosahedron. (b) Geometry of the putative ground minimum for Au 147 found using an ANN force field. Figure (b) is colour coded so to highlight the three shells of Au atoms. Figure reprinted from Jindal, Chiriki, and Bulusu [Citation71], with the permission of AIP Publishing.](/cms/asset/2842056f-d4c9-4c69-a82a-853bbe090912/tapx_a_1654919_f0010_oc.jpg)