
Figures & data
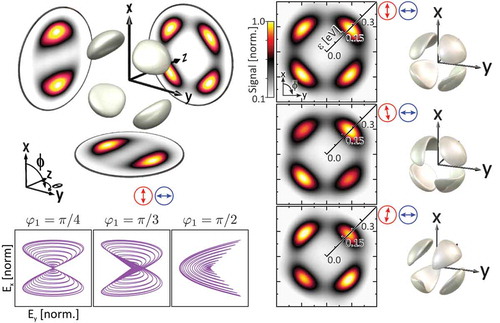
Figure 1. Ionization schemes for bichromatic MPI ( is the ionization potential). (a) Third-order intrapulse frequency mixing from MPI with temporally overlapping (
fs) incommensurable bichromatic fields. (b)–(c) MPI driven by temporally overlapping (
:
) fields.
denotes the nonlinear spectra for the absorption of
LCP and
RCP photons. (c)
- vs.
-photon interferences persist when the pulses are temporally separated (
).
describes the pulse duration of the fields of both colors.
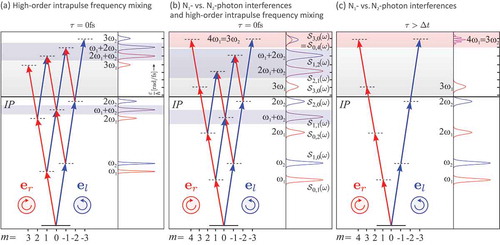
Figure 2. (a) Setup for VMI-based photoelectron tomography [Citation99] for measurements of second-order intrapulse frequency mixing in the MPI of K atoms with (:
) fields. Polarization-shaped (
:
) pulses are generated by a Mach–Zehnder interferometer equipped with quarter wave plates (QWPs) and half wave plates (HWPs). The fields are recombined with a dichroic mirror (DM) and focused with a spherical mirror (SFM) into the interaction region. For the photoelectron tomography, the pulses are rotated about the propagation axis with an additional HWP. Photoelectron wave packets created by MPI are projected onto a microchannel plate (MCP) detector followed by a phosphor screen and recorded by a charged coupled device (CCD) camera. (b) Selected projections generated by MPI with (
:
) OLP fields. The photoelectron wave packets have a fourfold rotational symmetry, causing symmetrical projections.
![Figure 2. (a) Setup for VMI-based photoelectron tomography [Citation99] for measurements of second-order intrapulse frequency mixing in the MPI of K atoms with (ω:2ω) fields. Polarization-shaped (ω:2ω) pulses are generated by a Mach–Zehnder interferometer equipped with quarter wave plates (QWPs) and half wave plates (HWPs). The fields are recombined with a dichroic mirror (DM) and focused with a spherical mirror (SFM) into the interaction region. For the photoelectron tomography, the pulses are rotated about the propagation axis with an additional HWP. Photoelectron wave packets created by MPI are projected onto a microchannel plate (MCP) detector followed by a phosphor screen and recorded by a charged coupled device (CCD) camera. (b) Selected projections generated by MPI with (ω:2ω) OLP fields. The photoelectron wave packets have a fourfold rotational symmetry, causing symmetrical projections.](/cms/asset/9caae2d6-07d8-4a7a-a6b7-801c70defd17/tapx_a_1672583_f0002_oc.jpg)
Figure 3. (a) Excitation scheme for second-order frequency mixing in the perturbative MPI of K atoms with (:
) CRCP fields. Two-photon CRCP ionization addresses
- and
-continuum states. The sign of the corresponding wave functions is color-coded. An (
:
) CRCP propeller pulse is illustrated in the inset. (b) Tomographically reconstructed 3D photoelectron density. The PMD is aligned along the laser propagation direction due to the interference of the
- and
-wave packets.
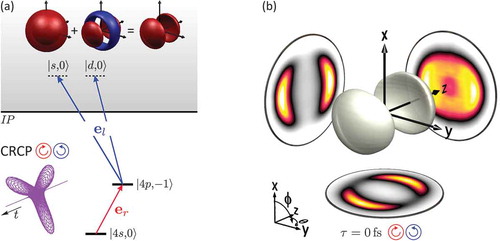
Figure 4. (a) Excitation scheme for second-order frequency mixing in the perturbative MPI of K atoms using (:
) OLP fields. The relative phase of
describes (
:
) OLP fields in the circular basis. (b) Measured real-valued photoelectron wave packet
with
rotational symmetry. (c)–(e) Measured
-
-sections taken through tomographically reconstructed photoelectron wave packets. Tilting the polarization of the red field leads to an inhomogeneity and a rotation in the azimuthal interference pattern, as shown in (d) and (e). Right: comparison to simulated 3D electron densities. (f) Polarization profiles of Lissajous-type (
:
) OLP fields for different relative phases
between both colors.
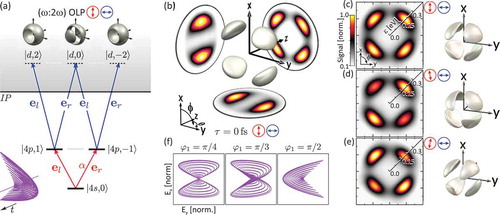
Figure 5. (a) Setup for the generation of polarization-tailored bichromatic laser fields using a composite polarizer in the Fourier plane of a white light polarization pulse shaper, based on a liquid crystal spatial light modulator (LC-SLM). For the generation of circularly polarized fields, a quarter wave plate (QWP) is mounted at the shaper output. (b)–(c) Shaper-based pulse characterization by spectrally resolved cross-correlation traces of (
:
) CRCP fields, along with the corresponding spectra
derived from the projections along the time axis. (b) The second-order cross-correlation trace has three distinct spectral peaks, two single-color contributions at
and a mixing contribution at
. (c) The first-order cross-correlation trace has two maxima centered at
, respectively.
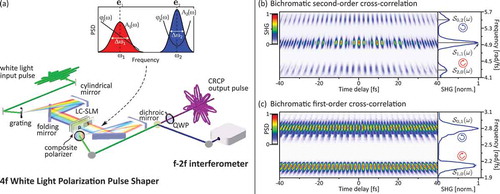
Figure 6. (a) Setup for photoelectron tomography based on VMI spectrometry. The polarization-shaped input pulse is focused into the interaction region filled with Na vapor using a spherical mirror (SFM). For the tomography, the shaped pulse is rotated about its propagation axis using a half wave plate (HWP). Projections of the wave packet are measured under different angles. The 3D density is retrieved from the projections using a Fourier-based reconstruction algorithm [Citation99]. (b) Selected projections from MPI with CRCP fields measured under different angles. The projections exhibit a lateral asymmetry, which is inverted seven times as the pulse is rotated about .
![Figure 6. (a) Setup for photoelectron tomography based on VMI spectrometry. The polarization-shaped input pulse is focused into the interaction region filled with Na vapor using a spherical mirror (SFM). For the tomography, the shaped pulse is rotated about its propagation axis using a half wave plate (HWP). Projections of the wave packet are measured under different angles. The 3D density is retrieved from the projections using a Fourier-based reconstruction algorithm [Citation99]. (b) Selected projections from MPI with CRCP fields measured under different angles. The projections exhibit a lateral asymmetry, which is inverted seven times as the pulse is rotated about π.](/cms/asset/950ac1e2-dfc6-498c-93ec-bb84ac1204ea/tapx_a_1672583_f0006_oc.jpg)
Figure 7. Illustration of the procedure for evaluating the CEP asymmetry contrast from the measured VMI images, as described by Equation (3). We calculate the difference of the measured photoelectron projections
for a CEP of
(a) and
(b). (c) The antisymmetric part of the difference
, i.e. the asymmetry contrast
emphasizing the CEP-dependent features.
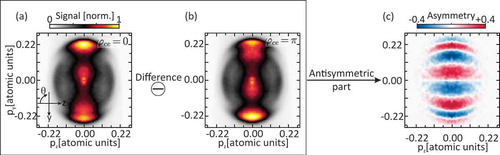
Figure 8. (a) Excitation scheme for the control of the CEP-sensitive photoemission from perturbative MPI of Na atoms using (:
) COCP and CRCP fields. (b) COCP fields create a PMD in the shape of a crescent. (c) CRCP fields generate a standing wave pattern with seven azimuthal lobes. In both cases the driving bichromatic fields are sketched in the inset, along with simulated 3D photoelectron wave packets. The measured CEP-dependent asymmetry contrast
(left) is compared to the simulation (right). The contributions from third-order frequency mixing are below the ionization potential of Na atoms (
eV).
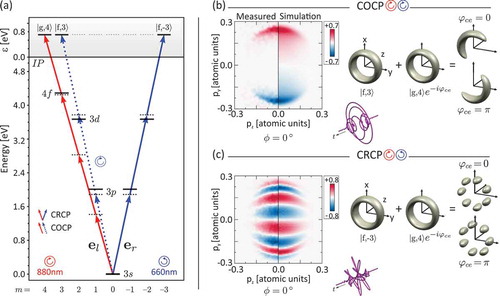
Figure 9. (a) Excitation scheme for CEP-sensitive photoelectron wave packets created by perturbative MPI of Na atoms with (:
) PLP and OLP fields. (b) Control of the directional photoemission by bichromatic PLP laser fields. (c)–(d) OLP fields lead to a superposition of states with opposite parity and orthogonal symmetry axis. In both cases, the driving fields are sketched in the insets, along with simulated 3D photoelectron wave packets. The measured CEP-dependent asymmetry contrasts
(left) are compared to simulations (right).
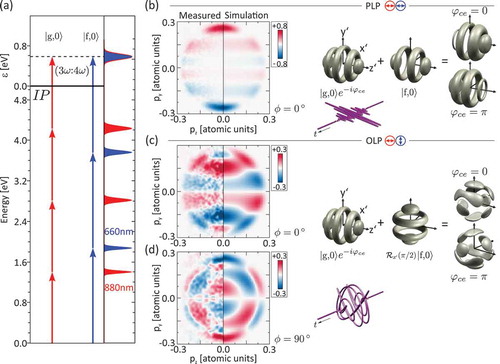
Table A1. Coefficients for the CRCP, COPC, OLP and PLP pulse sequences used in the experiments.