
Figures & data
Figure 1. Simplified mechanism of nanoparticle aerosol formation via flame synthesis. Under the vapour-to-cluster route, the atomized liquid precursor undergoes full evaporation and nucleation to form nanoparticle aerosols/nanowires. Under droplet-to-cluster route, the atomized liquid precursor undergoes partial evaporation leading to incomplete nucleation resulting in the formation of large or hollow particle aerosols
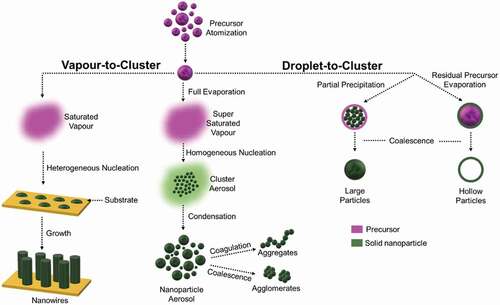
Figure 2. Different types of burners (a, b) and atomizer (c) employed in flame spray setups. (a) Flame Spray Pyrolysis. (b) Hydrogen-Oxygen Flame. (c) Ultrasonic atomizer
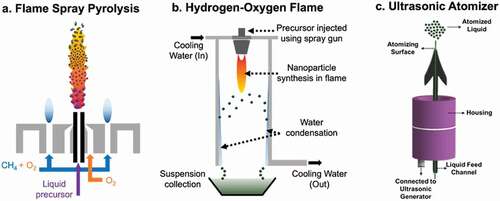
Figure 3. Effect of deposition temperature and regime on the film morphology obtainable by self-assembly of aerosol nanoparticles. High sintering rate leads to simultaneous deposition and coalescence of aerosol particles resulting in a wide range of porous (~12%–80%) nanostructures. Low sintering rate of self-assembly can proceed either through Brownian diffusion, randomly oriented ballistic deposition, or ballistic motion resulting in films with ~98% to ~86% average porosity
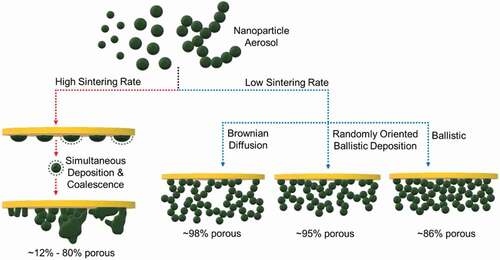
Figure 4. SEM image of (a) TiO2 films deposited at 4.1 cm resulting in granular morphology. (b) TiO2 films deposited at 1.7 cm resulting in columnar morphology
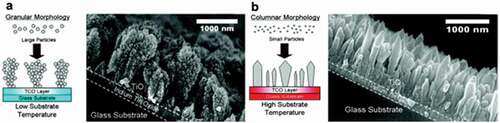
Figure 5. (a) Limiting porosities as a number of primary particles in an agglomerate. (b) Limiting porosities as a function of fractal dimension (Df). (c) Representive slice packing density profiles in the ballistic diffusion regime. (d) Structures of aerosol deposited formed by filtration of nanoparticles (50 nm) for Pe = 0.01–10. (e) Solid volume fraction profile for Pe = 10 and Rc = 1, 2, 4 μm. (f) Top-view SEM of SnO2 nanoparticle aerosol film deposited using FSP with 98% porosity. Reprinted with permission [Citation3,Citation15,Citation16,Citation55]
![Figure 5. (a) Limiting porosities as a number of primary particles in an agglomerate. (b) Limiting porosities as a function of fractal dimension (Df). (c) Representive slice packing density profiles in the ballistic diffusion regime. (d) Structures of aerosol deposited formed by filtration of nanoparticles (50 nm) for Pe = 0.01–10. (e) Solid volume fraction profile for Pe = 10 and Rc = 1, 2, 4 μm. (f) Top-view SEM of SnO2 nanoparticle aerosol film deposited using FSP with 98% porosity. Reprinted with permission [Citation3,Citation15,Citation16,Citation55]](/cms/asset/c34050e1-9466-4900-9cd9-a1f96e252d36/tapx_a_1997153_f0005_oc.jpg)
Figure 6. (a) Simplified schematic illustration of the photo-catalysis mechanism. (b) H2 production from methanol reformation using different TiO2 samples. (c) Oxygen evolution of aqueous modified BiVO4 under visible light irradiation (λ = 420 nm). (d) Yield of CO produced after CO2 reduction using ZnO/CeO2 nanocomposites (e) Yield of CH4 produced after CO2 reduction using ZnO/CeO2 nanocomposites. (f) Absorbance spectra of methyl Orange with La2Ti2O7 nanoparticles treated at 1000°C/3 h/air after UV irradiation. Reprinted with permission [Citation93–96]
![Figure 6. (a) Simplified schematic illustration of the photo-catalysis mechanism. (b) H2 production from methanol reformation using different TiO2 samples. (c) Oxygen evolution of aqueous modified BiVO4 under visible light irradiation (λ = 420 nm). (d) Yield of CO produced after CO2 reduction using ZnO/CeO2 nanocomposites (e) Yield of CH4 produced after CO2 reduction using ZnO/CeO2 nanocomposites. (f) Absorbance spectra of methyl Orange with La2Ti2O7 nanoparticles treated at 1000°C/3 h/air after UV irradiation. Reprinted with permission [Citation93–96]](/cms/asset/5273702a-89e6-41b3-af89-f183110d9a87/tapx_a_1997153_f0006_oc.jpg)
Figure 7. (a) Schematic representation of H2 production using (photo)electrochemical catalytic mechanism. (b) Dependence of photocurrent-time plots for BiVO4 and BiVO4-rGO electrodes (Inset: photocurrent transient response curve at a constant potential). (c) Photocurrent density of CuO/ITO electrodes at different sintering temperatures. (d) Cyclic voltammogram of 1st, 300th, 600th, and 1000th cycles for 5 s deposited Co3O4 nano-islands. (e) Long-term electro-catalytic testing at a constant current density of 10 mA/cm2 for the 5 s deposited Co3O4 nano-islands. (f) Cross-sectional SEM micrograph depicting flame made BiVO4 photoanodes at different heights above burner: 15 cm, 10 cm, and 6 cm showcasing different porosities. Reprinted with permission [Citation9,Citation60,Citation98,Citation100]
![Figure 7. (a) Schematic representation of H2 production using (photo)electrochemical catalytic mechanism. (b) Dependence of photocurrent-time plots for BiVO4 and BiVO4-rGO electrodes (Inset: photocurrent transient response curve at a constant potential). (c) Photocurrent density of CuO/ITO electrodes at different sintering temperatures. (d) Cyclic voltammogram of 1st, 300th, 600th, and 1000th cycles for 5 s deposited Co3O4 nano-islands. (e) Long-term electro-catalytic testing at a constant current density of 10 mA/cm2 for the 5 s deposited Co3O4 nano-islands. (f) Cross-sectional SEM micrograph depicting flame made BiVO4 photoanodes at different heights above burner: 15 cm, 10 cm, and 6 cm showcasing different porosities. Reprinted with permission [Citation9,Citation60,Citation98,Citation100]](/cms/asset/9df52a3b-9508-4203-b0e3-28dd174ffe82/tapx_a_1997153_f0007_oc.jpg)
Figure 8. (a) Operational illustration of a thermochemical catalytic reactor. (b) H2 and CO production rates during 100 cycles of CO2 splitting using 3% Ce-Mn3O4. (c) H2 and CO yield produced using 3% Ce-Mn3O4. (d) Methanol production for different materials. (e) CO oxidation of different Hopcalite nanoparticles synthesized from nitrates through inverse micro-emulsions. (f) H2/CO ratio produced using 10 wt.% Ni supported Si/CeZr synthesized using D-FSP. Reprinted with permission [Citation103–106]
![Figure 8. (a) Operational illustration of a thermochemical catalytic reactor. (b) H2 and CO production rates during 100 cycles of CO2 splitting using 3% Ce-Mn3O4. (c) H2 and CO yield produced using 3% Ce-Mn3O4. (d) Methanol production for different materials. (e) CO oxidation of different Hopcalite nanoparticles synthesized from nitrates through inverse micro-emulsions. (f) H2/CO ratio produced using 10 wt.% Ni supported Si/CeZr synthesized using D-FSP. Reprinted with permission [Citation103–106]](/cms/asset/c84899be-9d08-4aa0-9741-e1454ffa98bf/tapx_a_1997153_f0008_oc.jpg)
Figure 9. (a) Simplified schematic representation of a fuel cell. (b) SEM micrograph representing a cross-sectional view of anode-electrolyte and cathode-electrolyte interface. (c) Arrhenius plots of ionic conductivity of Ce1-xGdxO2-x/2. (d) TEM micrograph of flame-made Ce1-xGdxO2-x/2. (e) Methanol oxidation and (f) CO stripping reactions by FSP synthesized carbon supported Pt-Ru catalyst compared to commercial E-TEK catalyst. Reprinted with permission [Citation5,Citation109,Citation110]
![Figure 9. (a) Simplified schematic representation of a fuel cell. (b) SEM micrograph representing a cross-sectional view of anode-electrolyte and cathode-electrolyte interface. (c) Arrhenius plots of ionic conductivity of Ce1-xGdxO2-x/2. (d) TEM micrograph of flame-made Ce1-xGdxO2-x/2. (e) Methanol oxidation and (f) CO stripping reactions by FSP synthesized carbon supported Pt-Ru catalyst compared to commercial E-TEK catalyst. Reprinted with permission [Citation5,Citation109,Citation110]](/cms/asset/355000be-a072-4a9d-9f1c-cb12ab7689c1/tapx_a_1997153_f0009_oc.jpg)
Figure 10. (a) Schematic mechanism of charge/discharge in a Li-ion battery. (b) Stepwise fabrication of LTO electrode and battery cell. (c) Charge/discharge curves of LTO batteries. (d) Charge/Discharge curves NCM111. (e) Schematic representation of peeling off strategy facilitated by self-supported ZIF-8 membrane for Li-S battery. (f) Electrochemical Impedance Spectrum depicting ionic conductivity and blocking effect. Reprinted with permission [Citation111–113]
![Figure 10. (a) Schematic mechanism of charge/discharge in a Li-ion battery. (b) Stepwise fabrication of LTO electrode and battery cell. (c) Charge/discharge curves of LTO batteries. (d) Charge/Discharge curves NCM111. (e) Schematic representation of peeling off strategy facilitated by self-supported ZIF-8 membrane for Li-S battery. (f) Electrochemical Impedance Spectrum depicting ionic conductivity and blocking effect. Reprinted with permission [Citation111–113]](/cms/asset/6b39ec48-c2b1-42db-b2aa-9ef47d4ec0fb/tapx_a_1997153_f0010_oc.jpg)
Figure 11. (a) Representation of a liquid drop on a (super)hydrophilic surface. (b) Flame deposited SiO2 nanofiber film. (c) Antifogging property demonstrated by flame-made pure SiO2, TiO2, and mixed silica-titania nanoparticle layers. (d) Anti-fogging property of SiO2 nanoparticles studied at different time intervals. (e) SEM micrograph of FSP deposited SiO2 coating on PC board. (f) Water contact angle measurement for different samples under dark and solar radiations. Reprinted with permission [Citation11,Citation121–123]
![Figure 11. (a) Representation of a liquid drop on a (super)hydrophilic surface. (b) Flame deposited SiO2 nanofiber film. (c) Antifogging property demonstrated by flame-made pure SiO2, TiO2, and mixed silica-titania nanoparticle layers. (d) Anti-fogging property of SiO2 nanoparticles studied at different time intervals. (e) SEM micrograph of FSP deposited SiO2 coating on PC board. (f) Water contact angle measurement for different samples under dark and solar radiations. Reprinted with permission [Citation11,Citation121–123]](/cms/asset/8841b4ec-96c2-48be-b591-2c181bb8da57/tapx_a_1997153_f0011_oc.jpg)
Figure 12. (a) Schematic representation of a liquid drop on a (super)hydrophobic surface. (b) Contact water angle was demonstrated by 2 μl water (left) and 5 μl hexadecane drop (right) on superamphiphobic substrate. (c) RMS roughness test as a function of number of revolutions after Taber wheel test on flame made TiO2 and SiO2 surfaces. (d) SEM micrograph of TiO2 nanoparticles deposited using FSP demonstrates water contact angle of 163°. (e) Schematic illustration of growth mechanism of omnidirectional transparent super-oleophobic nanostructure. (f) Optical image representing water, n-tetradecane, sunflower oil, and ethylene glycol on super-oleophobic surface. (g) Detailed schematic representing synthesis of SAP (h): SAP (left) and bare needle (right) dipped in tetradecane oil displaying contamination-free property. Reprinted with permission [Citation12,Citation125–128]
![Figure 12. (a) Schematic representation of a liquid drop on a (super)hydrophobic surface. (b) Contact water angle was demonstrated by 2 μl water (left) and 5 μl hexadecane drop (right) on superamphiphobic substrate. (c) RMS roughness test as a function of number of revolutions after Taber wheel test on flame made TiO2 and SiO2 surfaces. (d) SEM micrograph of TiO2 nanoparticles deposited using FSP demonstrates water contact angle of 163°. (e) Schematic illustration of growth mechanism of omnidirectional transparent super-oleophobic nanostructure. (f) Optical image representing water, n-tetradecane, sunflower oil, and ethylene glycol on super-oleophobic surface. (g) Detailed schematic representing synthesis of SAP (h): SAP (left) and bare needle (right) dipped in tetradecane oil displaying contamination-free property. Reprinted with permission [Citation12,Citation125–128]](/cms/asset/8b55bc35-46d3-46fa-b2f2-355e014cf75e/tapx_a_1997153_f0012_oc.jpg)
Figure 13. (a) Schematic description of introduction of FSP synthesized nanomaterials into the cell for TERM applications. (b) Real-time Reverse Transcription Polymerase Chain Reaction (RT-PCR) analysis of osteocalcin indicating up-regulation in cell culture in the presence of Sr-doped glass nanoparticles. (c) SEM micrograph depicting interaction between cell and coating after 14 days on the ultraporous neural network and spin-coated surface. (d) Immunostaining analysis of F-Actin and Osteocalcin. Reprinted with permission [Citation10,Citation132]
![Figure 13. (a) Schematic description of introduction of FSP synthesized nanomaterials into the cell for TERM applications. (b) Real-time Reverse Transcription Polymerase Chain Reaction (RT-PCR) analysis of osteocalcin indicating up-regulation in cell culture in the presence of Sr-doped glass nanoparticles. (c) SEM micrograph depicting interaction between cell and coating after 14 days on the ultraporous neural network and spin-coated surface. (d) Immunostaining analysis of F-Actin and Osteocalcin. Reprinted with permission [Citation10,Citation132]](/cms/asset/e869078f-9e14-4d69-a662-fbe7b2664b7b/tapx_a_1997153_f0013_oc.jpg)
Figure 14. (a) Schematic summary of different antimicrobial mechanisms facilitated by FSP synthesized nanomaterials. (b) Scanning Transmission Electron Microscopy (STEM) micrograph of Ag/SiO2 nanoparticles synthesized using silver acetate/HDMSO precursor solution. (c) Scanning Transmission Electron Microscopy (STEM) micrograph of Ag/SiO2 nanoparticles synthesized using silver nitrate/HDMSO precursor solution. (d) SEM micrograph of PET paper sample before (inset) and after coating of Ag NPs. (e) Study of antimicrobial property of Ag NPs coated on PET paper against E. coli. (f) Digital image of crystal violet stained uncoated and TiO2 and P25 coated aluminium substrates with and without UV irradiation. (f) Spectrophotometric study (at 595 nm) of biofilm mass quantification using crystal violet staining. Reprinted with permission [Citation133–135]
![Figure 14. (a) Schematic summary of different antimicrobial mechanisms facilitated by FSP synthesized nanomaterials. (b) Scanning Transmission Electron Microscopy (STEM) micrograph of Ag/SiO2 nanoparticles synthesized using silver acetate/HDMSO precursor solution. (c) Scanning Transmission Electron Microscopy (STEM) micrograph of Ag/SiO2 nanoparticles synthesized using silver nitrate/HDMSO precursor solution. (d) SEM micrograph of PET paper sample before (inset) and after coating of Ag NPs. (e) Study of antimicrobial property of Ag NPs coated on PET paper against E. coli. (f) Digital image of crystal violet stained uncoated and TiO2 and P25 coated aluminium substrates with and without UV irradiation. (f) Spectrophotometric study (at 595 nm) of biofilm mass quantification using crystal violet staining. Reprinted with permission [Citation133–135]](/cms/asset/281f48f6-a74b-498f-a7cb-49580f117320/tapx_a_1997153_f0014_oc.jpg)
Figure 15. (a) Sensing mechanism of a chemiresistive gas sensor. (b) Sensor signal of different Pt doped SnO2 sensor towards different CO concentrations at 400°C. (c) Sensor response of 10 mol% Si-doped WO3 towards acetone (600 ppb) at different relative humidity at 400°C. (d) Dynamic changes in resistance under exposure of H2 at 150°C. (e) Selectivity plot of the developed Pt doped WO3 sensor towards interfering analytes. (f) Selectivity plots of 0.5 wt.% CuO doped SnO2 respectively. Reprinted with permission [Citation6,Citation141–143]
![Figure 15. (a) Sensing mechanism of a chemiresistive gas sensor. (b) Sensor signal of different Pt doped SnO2 sensor towards different CO concentrations at 400°C. (c) Sensor response of 10 mol% Si-doped WO3 towards acetone (600 ppb) at different relative humidity at 400°C. (d) Dynamic changes in resistance under exposure of H2 at 150°C. (e) Selectivity plot of the developed Pt doped WO3 sensor towards interfering analytes. (f) Selectivity plots of 0.5 wt.% CuO doped SnO2 respectively. Reprinted with permission [Citation6,Citation141–143]](/cms/asset/c8b4dea9-388b-4a99-97c1-dd2d88c4614c/tapx_a_1997153_f0015_oc.jpg)
Figure 16. (a) Plasmonic sensing mechanism based on the detection of transmitted light. (b) Schematic illustration of enclosed flame reactor for synthesis of SiO2-Ag NP. (c) Plasmonic biosensor adsorption kinetics of partially coated (squared, triangles) and fully coated (circles, diamonds) SiO2-Ag NP. (d) Schematic rendering of resonant Au-TiO2 fractal metamaterial. (e) Dynamic LSPR response of the resonant fractal metamaterial towards various concentrations of toluene. (f) Bar plot representing response of Au-Bi2O3 towards different VOCs exposed at different concentrations. Reprinted with permission [Citation144,Citation150,Citation152]
![Figure 16. (a) Plasmonic sensing mechanism based on the detection of transmitted light. (b) Schematic illustration of enclosed flame reactor for synthesis of SiO2-Ag NP. (c) Plasmonic biosensor adsorption kinetics of partially coated (squared, triangles) and fully coated (circles, diamonds) SiO2-Ag NP. (d) Schematic rendering of resonant Au-TiO2 fractal metamaterial. (e) Dynamic LSPR response of the resonant fractal metamaterial towards various concentrations of toluene. (f) Bar plot representing response of Au-Bi2O3 towards different VOCs exposed at different concentrations. Reprinted with permission [Citation144,Citation150,Citation152]](/cms/asset/929daa05-2e30-4aa2-b069-843b01290887/tapx_a_1997153_f0016_oc.jpg)
Figure 17. (a) Simplified schematic of the working principle of a photoresistor detector based on a porous network of semiconductor nanoparticles. (b) I–V characteristic (c) responsivity graphs of ZnO ultra porous photodetectors as a function of light and bias. (d) Schematic architectural representation of the photodetector device was composed of a photoresponsive nanoparticle layer (ZnO), a dielectric spacer layer (SiO2), and a highly transparent tunable filter layer (TiO2). (e) I–V characteristics of the device as a function of the TiO2 film thickness (illumination = 370 nm; light density = 86 μW /cm2 (f) I–V characteristics of 40 s sputtered NiO/ZnO under dark and UV lights condition at a bias between 0 and 2 mV. Reprinted with permission [Citation8,Citation154,Citation155]
![Figure 17. (a) Simplified schematic of the working principle of a photoresistor detector based on a porous network of semiconductor nanoparticles. (b) I–V characteristic (c) responsivity graphs of ZnO ultra porous photodetectors as a function of light and bias. (d) Schematic architectural representation of the photodetector device was composed of a photoresponsive nanoparticle layer (ZnO), a dielectric spacer layer (SiO2), and a highly transparent tunable filter layer (TiO2). (e) I–V characteristics of the device as a function of the TiO2 film thickness (illumination = 370 nm; light density = 86 μW /cm2 (f) I–V characteristics of 40 s sputtered NiO/ZnO under dark and UV lights condition at a bias between 0 and 2 mV. Reprinted with permission [Citation8,Citation154,Citation155]](/cms/asset/60444bb0-5b31-48bd-9ebe-8f8ec048bd5b/tapx_a_1997153_f0017_oc.jpg)
Table 1. Techniques employed for characterization of flame-based aerosol films