
Figures & data

Figure 1. Scheme of high-order harmonic generation. When an intense laser is focused on a target, atoms, molecules or bulk matter, high-order harmonics of the driving laser field, i.e. high energy photons, are generated
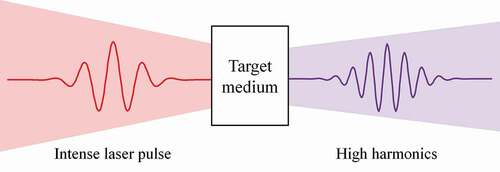
Figure 2. Measured high-order harmonic signals for ZnO driven by a mid-infrared (
m) laser source [Citation8]. (a) the HHG cutoff reaches up to the 17th (25th) order for a laser energy of 0.52 (2.63)
J. (b) The HHG cutoff increases linearly with the driving laser field strength in the range of 0.2 to 0.6 V/Å. (c) Measured intensity of the 9th – to 21st-order harmonics as a function of the driving laser intensity. Each harmonic intensity increases proportionally to the order of the process below 1.0 TW/cm2 and linearly to the driving laser intensity above 1.0 TW/cm2
![Figure 2. Measured high-order harmonic signals for ZnO driven by a mid-infrared (λ=3.25 μ m) laser source [Citation8]. (a) the HHG cutoff reaches up to the 17th (25th) order for a laser energy of 0.52 (2.63) μ J. (b) The HHG cutoff increases linearly with the driving laser field strength in the range of 0.2 to 0.6 V/Å. (c) Measured intensity of the 9th – to 21st-order harmonics as a function of the driving laser intensity. Each harmonic intensity increases proportionally to the order of the process below 1.0 TW/cm2 and linearly to the driving laser intensity above 1.0 TW/cm2](/cms/asset/25ec2d32-8b5a-4155-8776-da2c78074c63/tapx_a_2003244_f0002_oc.jpg)
Figure 3. (a) The table represents a set of materials used in solid-HHG experiments, as a function of both the photon energy of the pump laser and the measured HHG cutoff [Citation52]. (b) HHG process in solids. When an intense laser is focused on a solid target, an electron moves from a valence band to a conduction band. The electron is accelerated along the conduction band landscape (intraband acceleration). Then it recombines with a hole on the valence band (interband transition). The high harmonics are emitted by both the electron-hole recombination (interband harmonics) and the accelerated motion of the electron (intraband harmonics)
![Figure 3. (a) The table represents a set of materials used in solid-HHG experiments, as a function of both the photon energy of the pump laser and the measured HHG cutoff [Citation52]. (b) HHG process in solids. When an intense laser is focused on a solid target, an electron moves from a valence band to a conduction band. The electron is accelerated along the conduction band landscape (intraband acceleration). Then it recombines with a hole on the valence band (interband transition). The high harmonics are emitted by both the electron-hole recombination (interband harmonics) and the accelerated motion of the electron (intraband harmonics)](/cms/asset/72da8736-f96e-4d58-a035-81cad5b965b6/tapx_a_2003244_f0003_oc.jpg)
Figure 4. Crystal-orientation dependence in solid-HHG. (a) High-order harmonics are induced by focusing an infrared laser on 001-cut MgO, which has a 4-fold symmetry. (b) The HHG signals are recorded as a function of the relative angle between the laser polarization direction and the crystal orientation of the MgO. The result exhibits a 4-fold periodicity [Citation41]. (c) The C-plane and M-plane in sapphire have a 6-fold and 4-fold symmetry, respectively. (d, e) HHG from sapphire when it is driven by an intense Ti:S laser. The recorded HHG signals as a function of the laser polarization angle show a 6 – and 4-fold periodicity for the C-plane and M-plane orientations, respectively, which is the same as each crystal symmetry [Citation46]
![Figure 4. Crystal-orientation dependence in solid-HHG. (a) High-order harmonics are induced by focusing an infrared laser on 001-cut MgO, which has a 4-fold symmetry. (b) The HHG signals are recorded as a function of the relative angle between the laser polarization direction and the crystal orientation of the MgO. The result exhibits a 4-fold periodicity [Citation41]. (c) The C-plane and M-plane in sapphire have a 6-fold and 4-fold symmetry, respectively. (d, e) HHG from sapphire when it is driven by an intense Ti:S laser. The recorded HHG signals as a function of the laser polarization angle show a 6 – and 4-fold periodicity for the C-plane and M-plane orientations, respectively, which is the same as each crystal symmetry [Citation46]](/cms/asset/4ee59e13-5b95-481c-b337-01de64ee9251/tapx_a_2003244_f0004_oc.jpg)
Figure 5. Ellipticity dependence in gas- and solid-HHG. Experimentally measured HHG signals from Ne (gas) driven by a 825 nm wavelength laser (a) [Citation81], and ZnO driven by a mid-infrared laser (b) [Citation8], respectively. The HHG is recorded for different ellipticities. The overall HHG signals significantly decrease, when the ellipticity increases. Specifically, the 19th – to 63th-order (7th – to 13th-order) harmonics generated from Ne gas (ZnO) are reduced by about a thousand times (a few times) when the ellipticity changes from 0 to 0.5. (c) HHG signals generated from a monolayer graphene driven by a mid-infrared laser. This layered material has a zero bandgap. As an exceptional case, it is reported that the 9th-order harmonic intensity increases when the ellipticity increases from 0 to 0.32. This behaviour is attributed to the intrinsic properties of the monolayer graphene [Citation48]
![Figure 5. Ellipticity dependence in gas- and solid-HHG. Experimentally measured HHG signals from Ne (gas) driven by a 825 nm wavelength laser (a) [Citation81], and ZnO driven by a mid-infrared laser (b) [Citation8], respectively. The HHG is recorded for different ellipticities. The overall HHG signals significantly decrease, when the ellipticity increases. Specifically, the 19th – to 63th-order (7th – to 13th-order) harmonics generated from Ne gas (ZnO) are reduced by about a thousand times (a few times) when the ellipticity changes from 0 to 0.5. (c) HHG signals generated from a monolayer graphene driven by a mid-infrared laser. This layered material has a zero bandgap. As an exceptional case, it is reported that the 9th-order harmonic intensity increases when the ellipticity increases from 0 to 0.32. This behaviour is attributed to the intrinsic properties of the monolayer graphene [Citation48]](/cms/asset/bf5eca8d-5e27-4169-af7f-65d450541dee/tapx_a_2003244_f0005_oc.jpg)
Figure 6. Experiment showing symmetry breaking effects in solid-HHG [Citation84]. (a) Scheme of the experimental setup; 3rd- and 5th-order harmonics are induced by a focused near-infrared laser (1595 nm) in stacked silicon wafers. They have interfaces where the bulk symmetry breaking occurs (e.g. Si-air and Si-air-Si). The harmonics are recorded by moving the beam focusing position along the optical axis. (b) The intensity of the 3rd- and 5th-order harmonics increases when the focusing is positioned at the interfaces
![Figure 6. Experiment showing symmetry breaking effects in solid-HHG [Citation84]. (a) Scheme of the experimental setup; 3rd- and 5th-order harmonics are induced by a focused near-infrared laser (1595 nm) in stacked silicon wafers. They have interfaces where the bulk symmetry breaking occurs (e.g. Si-air and Si-air-Si). The harmonics are recorded by moving the beam focusing position along the optical axis. (b) The intensity of the 3rd- and 5th-order harmonics increases when the focusing is positioned at the interfaces](/cms/asset/ef22bf29-8818-497c-9b2e-008c781812f8/tapx_a_2003244_f0006_oc.jpg)
Figure 7. Symmetry breaking even-order harmonics generation in solids. (a, b) HHG are induced by focusing a near-infrared laser on a monolayer and bulk MoS2 [Citation49]. While the odd-order harmonics are detected for both cases, the even-order harmonics are detected only for the monolayer MoS2. The even-order harmonics generation is believed to be induced by the innate inversion symmetry breaking of the monolayer. (c, d) Simplified pictorial description for the electron’s trajectory during the HHG process; If only the fundamental beam is focused on a nonlinear target, the electron promoted to the conduction band travels along a symmetric trajectory (see red dashed lines on (c)). Because of the electron’s symmetric motion, only odd-order harmonics can be detected, not the even-order ones. Vampa et al. show odd – and even-order harmonics generation from ZnO driven by a focused mid-infrared pump laser join with its second, weaker, harmonic [Citation38]. Because the second harmonic beam modifies the symmetry of the electron trajectory, turning it slightly asymmetrical (i.e. symmetry breaking), even-order harmonics are visible (see blue solid lines on (c))
![Figure 7. Symmetry breaking even-order harmonics generation in solids. (a, b) HHG are induced by focusing a near-infrared laser on a monolayer and bulk MoS2 [Citation49]. While the odd-order harmonics are detected for both cases, the even-order harmonics are detected only for the monolayer MoS2. The even-order harmonics generation is believed to be induced by the innate inversion symmetry breaking of the monolayer. (c, d) Simplified pictorial description for the electron’s trajectory during the HHG process; If only the fundamental beam is focused on a nonlinear target, the electron promoted to the conduction band travels along a symmetric trajectory (see red dashed lines on (c)). Because of the electron’s symmetric motion, only odd-order harmonics can be detected, not the even-order ones. Vampa et al. show odd – and even-order harmonics generation from ZnO driven by a focused mid-infrared pump laser join with its second, weaker, harmonic [Citation38]. Because the second harmonic beam modifies the symmetry of the electron trajectory, turning it slightly asymmetrical (i.e. symmetry breaking), even-order harmonics are visible (see blue solid lines on (c))](/cms/asset/81cb3154-b9bd-4201-9161-18abbc2f1e3e/tapx_a_2003244_f0007_oc.jpg)
Figure 8. Reconstruction of the electronic band structure in ZnO. Odd – and even-order harmonics are induced in ZnO, when driven by an intense mid-infrared pump laser, and a weaker second harmonic beam, treated as a perturbation [Citation80]. (a) The HHG signals are experimentally recorded as a function of the time delay between the fundamental and the second harmonic beams. (b) The experimentally measured and calculated optimum phases. (c) A reconstructed momentum-dependent band structure. Electrons in the first conduction band (blue line) recombine with holes in a split-off valence band (green line) generating the 10th – and 16th-order harmonics
![Figure 8. Reconstruction of the electronic band structure in ZnO. Odd – and even-order harmonics are induced in ZnO, when driven by an intense mid-infrared pump laser, and a weaker second harmonic beam, treated as a perturbation [Citation80]. (a) The HHG signals are experimentally recorded as a function of the time delay between the fundamental and the second harmonic beams. (b) The experimentally measured and calculated optimum phases. (c) A reconstructed momentum-dependent band structure. Electrons in the first conduction band (blue line) recombine with holes in a split-off valence band (green line) generating the 10th – and 16th-order harmonics](/cms/asset/d46b5e0f-07e3-4bec-92fb-e4c1aa32aa55/tapx_a_2003244_f0008_oc.jpg)
Figure 9. (a) Laser picoscopy setup. HHG signals are generated from MgF2 by a focused few-cycle pulse (5.5 fs, 2 eV). The beam polarization is aligned along the and
crystal orientations. (b, c) The blue lines represent the variation of the valence potential along the
and
directions, respectively. (d) The valence electron potential in MgF2 is retrieved with picometer accuracy [Citation44]
![Figure 9. (a) Laser picoscopy setup. HHG signals are generated from MgF2 by a focused few-cycle pulse (5.5 fs, 2 eV). The beam polarization is aligned along the ⟨110⟩ and ⟨100⟩ crystal orientations. (b, c) The blue lines represent the variation of the valence potential along the ⟨110⟩ and ⟨100⟩ directions, respectively. (d) The valence electron potential in MgF2 is retrieved with picometer accuracy [Citation44]](/cms/asset/e7586d35-5824-4c76-8e28-609c2d1d20f4/tapx_a_2003244_f0009_oc.jpg)
Figure 10. Plasmonic-assisted HHG [Citation97] (a) scheme of the experimental setup. The inset represents the fabricated nanostructure sample. HHG is induced by infrared pulses (
m and 100 fs). (b, c) Calculated intensity enhancement in the designed nano-antenna for parallel and perpendicular polarizations with respect to the
crystal orientation, respectively. (d) Measured high-order harmonic emission for the parallel (red) and the perpendicular (green) polarizations. The black line represents the HHG from a bare Si, without including the nano-antenna
![Figure 10. Plasmonic-assisted HHG [Citation97] (a) scheme of the experimental setup. The inset represents the fabricated nanostructure sample. HHG is induced by infrared pulses (λc=2.1 μ m and 100 fs). (b, c) Calculated intensity enhancement in the designed nano-antenna for parallel and perpendicular polarizations with respect to the ⟨110⟩ crystal orientation, respectively. (d) Measured high-order harmonic emission for the parallel (red) and the perpendicular (green) polarizations. The black line represents the HHG from a bare Si, without including the nano-antenna](/cms/asset/bc38a21d-89e7-4bde-ace0-2520354ab4d8/tapx_a_2003244_f0010_oc.jpg)
Figure 11. Plasmonic-assisted HHG [Citation96] (a) Scheme of SPP-assisted HHG with a funnel-waveguide nanostructure. (b) The fabricated funnel-waveguide nanostructures. (c) Calculated intensity enhancement for the xy-plane on the sapphire tip (left) and cross section of the xz-plane (right). (d) HHG from the nanostructure sample and a bare sapphire driven by a laser intensity of 0.42 and 1.58 TW/cm2, respectively
![Figure 11. Plasmonic-assisted HHG [Citation96] (a) Scheme of SPP-assisted HHG with a funnel-waveguide nanostructure. (b) The fabricated funnel-waveguide nanostructures. (c) Calculated intensity enhancement for the xy-plane on the sapphire tip (left) and cross section of the xz-plane (right). (d) HHG from the nanostructure sample and a bare sapphire driven by a laser intensity of 0.42 and 1.58 TW/cm2, respectively](/cms/asset/f9f70b44-0b52-4a9d-86d8-e8b64f7427ec/tapx_a_2003244_f0011_oc.jpg)
Figure 12. Fano-resonant silicon metasurface [Citation106] (a) The fabricated metasurface consists of bar antennas and disk resonators. (b) The bar forms a bright mode and can be excited by resonant wavelength light with polarization parallel to the bars. The disk forms a dark mode and can interact with the bright mode via near-field coupling. The combination of the bar and the disk forms a three-level Fano-resonant system. (c) Calculated and measured transmission in the resonant metasurface around the resonant wavelength. A sharp Fano-resonance peak is observed. (d, e) Calculated mode amplitude of the bar and the disk. (f) Time evolution of the excited fields at the bar center, disk center, disk edge (corresponding to B, C, and E points on (d, e)), and unpatterned Si for comparison. (g) Measured HHG driven by a laser intensity of 0.071 TW/cm2 with parallel and perpendicular polarizations, respectively. (h) Measured HHG yields of the 5th-, 7th-, and 9th-order harmonic as a function of the excitation intensity
![Figure 12. Fano-resonant silicon metasurface [Citation106] (a) The fabricated metasurface consists of bar antennas and disk resonators. (b) The bar forms a bright mode and can be excited by resonant wavelength light with polarization parallel to the bars. The disk forms a dark mode and can interact with the bright mode via near-field coupling. The combination of the bar and the disk forms a three-level Fano-resonant system. (c) Calculated and measured transmission in the resonant metasurface around the resonant wavelength. A sharp Fano-resonance peak is observed. (d, e) Calculated mode amplitude of the bar and the disk. (f) Time evolution of the excited fields at the bar center, disk center, disk edge (corresponding to B, C, and E points on (d, e)), and unpatterned Si for comparison. (g) Measured HHG driven by a laser intensity of 0.071 TW/cm2 with parallel and perpendicular polarizations, respectively. (h) Measured HHG yields of the 5th-, 7th-, and 9th-order harmonic as a function of the excitation intensity](/cms/asset/75311385-bc6b-4019-9194-fea5fdcaaa17/tapx_a_2003244_f0012_oc.jpg)
Figure 13. Steering beam propagation of extreme ultraviolet (EUV) harmonics by shaping a surface of a solid target [Citation46]. EUV high-order harmonics are induced at both the sapphire samples with a flat surface and the sloped surface cut at an angle of , by focusing near-infrared pulses (
nm, 12 fs, 1.31 TW/cm2) with a convergence angle of
. Beam propagation profiles of the EUV high-order harmonics generated at the flat surface (a) and the sloped surface (b), respectively. The profiles are recorded by changing the gap distance between the sapphire and a microchannel plate. Schematic of the beam propagation of the EUV beam generated at the flat surface (c) and the sloped surface (d), respectively
![Figure 13. Steering beam propagation of extreme ultraviolet (EUV) harmonics by shaping a surface of a solid target [Citation46]. EUV high-order harmonics are induced at both the sapphire samples with a flat surface and the sloped surface cut at an angle of 30∘, by focusing near-infrared pulses (λc=800 nm, 12 fs, 1.31 TW/cm2) with a convergence angle of 25∘. Beam propagation profiles of the EUV high-order harmonics generated at the flat surface (a) and the sloped surface (b), respectively. The profiles are recorded by changing the gap distance between the sapphire and a microchannel plate. Schematic of the beam propagation of the EUV beam generated at the flat surface (c) and the sloped surface (d), respectively](/cms/asset/b9405891-e19c-4a9b-a32e-13af29726e27/tapx_a_2003244_f0013_oc.jpg)
Figure 14. (a) Schematic of an integrated Fresnel zone plate (FZP) target in silicon leading to self-focusing of the generated high-order harmonics [Citation114]. (b) A SEM image of a fabricated gallium-implanted FZP pattern (darker area) in Si. High-order harmonics up to the 9th-order (250 nm) are induced by focusing ultrashort infrared pulses (
m, 70 fs, above
W/cm2). For imaging, the signals are recorded with a high numerical aperture objective lens (63x, NA = 0.75) and a bandpass filter. (c) The measured 3rd-order harmonic emission profile on the FZP pattern plane. The inset shows an SEM image of the FZP pattern corresponding to its profile. (d, e) Focus scans of the 3rd – and 5th-order harmonic, respectively, as a function of the distance to the pattern plane. The scans are obtained by moving the collecting objective lens relative to the FZP pattern. (f) Measured beam widths at each focal point; the 3rd – and 5th-order harmonics are focused up to diffraction-limited spot sizes, corresponding to each wavelength and diffraction order
![Figure 14. (a) Schematic of an integrated Fresnel zone plate (FZP) target in silicon leading to self-focusing of the generated high-order harmonics [Citation114]. (b) A SEM image of a fabricated gallium-implanted FZP pattern (darker area) in Si. High-order harmonics up to the 9th-order (250 nm) are induced by focusing ultrashort infrared pulses (λc=2.25 μ m, 70 fs, above 1012 W/cm2). For imaging, the signals are recorded with a high numerical aperture objective lens (63x, NA = 0.75) and a bandpass filter. (c) The measured 3rd-order harmonic emission profile on the FZP pattern plane. The inset shows an SEM image of the FZP pattern corresponding to its profile. (d, e) Focus scans of the 3rd – and 5th-order harmonic, respectively, as a function of the distance to the pattern plane. The scans are obtained by moving the collecting objective lens relative to the FZP pattern. (f) Measured beam widths at each focal point; the 3rd – and 5th-order harmonics are focused up to diffraction-limited spot sizes, corresponding to each wavelength and diffraction order](/cms/asset/d8cc46e7-079e-4eb8-ac6f-57e62c3089c9/tapx_a_2003244_f0014_oc.jpg)
Figure 15. Metalens enabling diffraction-limited focusing [Citation127]. (a) Pancharatnam-Berry phase; a nanofin arranged at an angle of induces a geometrical phase of
to the incident beam. (b) Schematic of a metalens composed of nanofins. Optical (c) and SEM (d) images of a fabricated matelens. Focal spot profiles of 532-nm light focused by the metalens (e) and by a commercial objective lens (100x Nikon CFI 60; NA = 0.8) (f) are recorded with a collecting objective lens (100x, NA = 0.9), tube lens, and CMOS camera. The focal spot sizes at FWHM are 375 and 600 nm, respectively
![Figure 15. Metalens enabling diffraction-limited focusing [Citation127]. (a) Pancharatnam-Berry phase; a nanofin arranged at an angle of θ induces a geometrical phase of 2θ to the incident beam. (b) Schematic of a metalens composed of nanofins. Optical (c) and SEM (d) images of a fabricated matelens. Focal spot profiles of 532-nm light focused by the metalens (e) and by a commercial objective lens (100x Nikon CFI 60; NA = 0.8) (f) are recorded with a collecting objective lens (100x, NA = 0.9), tube lens, and CMOS camera. The focal spot sizes at FWHM are 375 and 600 nm, respectively](/cms/asset/86a7df73-4908-40a3-8aba-cc0ed0377449/tapx_a_2003244_f0015_oc.jpg)