Figures & data
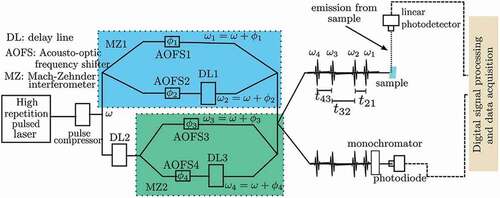
Figure 1. Schematics of experimental setup for fluorescence-detected two dimensional spectroscopy (FD2DS). A pulsed laser beam is split into two. Each beam goes through a Mach-Zehnder interferometer (MZ). Acousto-optic frequency shifters AOFS1, 2, 3 and 4 on the arms of the interferometers MZ1 and MZ2 modulate the phases of the beams at frequencies ,
,
and
, respectively. The AOFs add substantial chirp to the pulses, thus pulse compressor(s) are necessary to compensate for the temporal broadening. The spectral width of the laser pulse should cover the electronic states that are of interest. Delay line DL1 controls the time delay
between the pulses (pulse 1 and pulse 2) in the two arms of MZ1. Similarly DL2 controls the time delay
between the pulses 2 and 3. The time delay
between pulse 4 and pulse 3 is controlled by DL3. All the beams after MZ1 and MZ2 are recombined using a 50/50 beam splitter. One of the outputs from the beam splitter is used to excite the sample, while the other output goes to a monochromator. The monochromator selects a narrow spectrum of the light, which is used as the reference. The fluorescence (signal) from the sample is detected by a sensitive photodetector and its output is detected phase synchronously with respect to the reference. Lock-in amplifiers or similar digital signal processing algorithms are used to demodulate the signals at the frequencies
(also known as rephasing signal) and
(also known as non-rephasing signal). The measured signals are complex valued, i.e. they have amplitude and phase components. The measured 2D response function
is Fourier transformed along
and
to obtain the a sequence of 2D spectra
at different pump-probe delay times
.
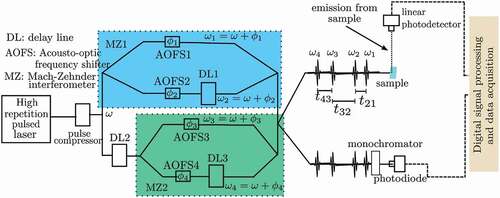
Figure 2. Arrangement of BChl chromophores in bacterial LH2 (a) and FD2D spectra when pump and probe pulses overlap (b) [Citation52]. The peaks on the diagonal at 800 nm and 850 nm are commonly assigned to the outer ring and the inner, respectively. The outer ring has 9 BChl molecules and the inner ring has 18 closely packed BChl molecules. The off-diagonal peaks indicate that absorption by one of the bands reduces the absorption by the other. A four-level system depicting the electronic states participating in the excitations by the pump and probe pulses (c). µ are the transition dipole moments. The corresponding FD2D spectra simulated using phase modulation (d) [Citation46].
![Figure 2. Arrangement of BChl chromophores in bacterial LH2 (a) and FD2D spectra when pump and probe pulses overlap (b) [Citation52]. The peaks on the diagonal at 800 nm and 850 nm are commonly assigned to the outer ring and the inner, respectively. The outer ring has 9 BChl molecules and the inner ring has 18 closely packed BChl molecules. The off-diagonal peaks indicate that absorption by one of the bands reduces the absorption by the other. A four-level system depicting the electronic states participating in the excitations by the pump and probe pulses (c). µ are the transition dipole moments. The corresponding FD2D spectra simulated using phase modulation (d) [Citation46].](/cms/asset/45eef6e0-cc86-4649-b379-ec8ee1287bf0/tapx_a_2090856_f0002_oc.jpg)
Figure 3. Feynman diagrams of the interaction pathways that give rise to rephasing signals in conventional 2D (left) and FD2DS (right). Similar pathways contribute to non-rephasing signals (see [Citation53] and [Citation46] for details). Dashed arrows represent coherent emission and wiggly arrows represent fluorescence from the system. Three pathways, ground state bleach (GSB), stimulated emission (SE) and excited state absorption (ESA), contribute to the signal in conventional 2D. The contributions from GSB and SE are positive while the contribution from ESA is negative. The sign of the contribution is given by (−1)n, where n is the number of interactions on the bra (or the ket) of the density matrix. Four pathways, GSB, SE, ESAI and ESAII, contribute to the signal in FD2DS out of which GSB, SE and ESAI have negative contributions and ESAII has positive contribution [Citation47]. In most molecular system, the population in the second excited state, relaxes to the first excited state,
, from which the fluorescence is emitted. Thus, ESAI and ESAII cancel each other, leaving GSB and SE as the net contributors to the signal.
![Figure 3. Feynman diagrams of the interaction pathways that give rise to rephasing signals in conventional 2D (left) and FD2DS (right). Similar pathways contribute to non-rephasing signals (see [Citation53] and [Citation46] for details). Dashed arrows represent coherent emission and wiggly arrows represent fluorescence from the system. Three pathways, ground state bleach (GSB), stimulated emission (SE) and excited state absorption (ESA), contribute to the signal in conventional 2D. The contributions from GSB and SE are positive while the contribution from ESA is negative. The sign of the contribution is given by (−1)n, where n is the number of interactions on the bra (or the ket) of the density matrix. Four pathways, GSB, SE, ESAI and ESAII, contribute to the signal in FD2DS out of which GSB, SE and ESAI have negative contributions and ESAII has positive contribution [Citation47]. In most molecular system, the population in the second excited state, |2⟩ relaxes to the first excited state, |1⟩, from which the fluorescence is emitted. Thus, ESAI and ESAII cancel each other, leaving GSB and SE as the net contributors to the signal.](/cms/asset/871af144-6366-4d53-8118-c227f2ac6eb7/tapx_a_2090856_f0003_oc.jpg)
Figure 4. Photocurrent-detected 2D spectroscopy (PC2DS) of PTB7/PC71BM binary donor-acceptor (left) and PTB7/PCDTBT/PC71BM ternery blend (right) solar cells. The power conversion efficiency of the binary blend is less than 5% while that of the ternery blend is 9.5%. Strong oscillations are observed only in the PC2DS of the ternary blend within 100 fs of the pump-probe delay, indicating that vibronic coherence contribute to the photocurrent generation in high efficiency polymer solar cells.
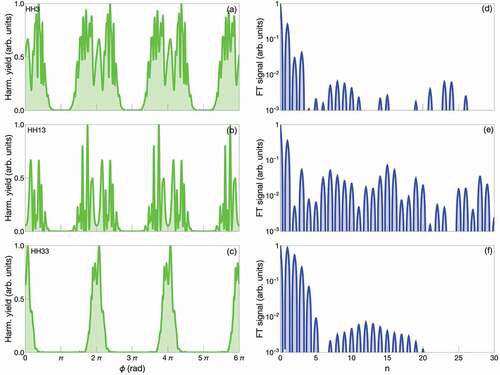
Figure 5. (a)-(c) high-harmonic order yield as a function of the phase between the pulses ; (d)-(f) Fourier transform of the panels (a)-(c) (in log scale).