Figures & data
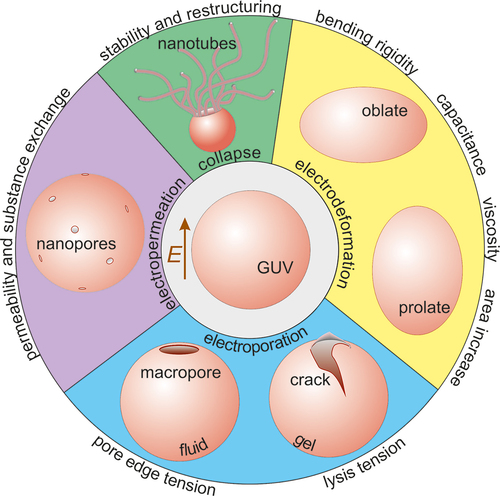
Table 1. Typical membrane material properties of lipid membranes in the fluid and gel phases deduced from manipulation of GUVs. Example techniques used to assess these properties are indicated with emphasis on approaches employing electric fields. For more references with data on specific properties, see respective sections.
Figure 1. Membrane bending rigidity obtained from different types of vesicle electromanipulation. (a) Electrodeformation of giant vesicles subjected to an AC field. Upper panel: Phase contrast images of a GUV at 300 kHz and field amplitudes of 2, 10 and 20 kV/m (left to right). The scale bar corresponds to 25 µm. Reproduced from [Citation40]. Lower panel: Change in the area of a GUV as a function of increasing electric field strength (the field strength is in V/m, and the curvatures in 1/m). From the slope of the data (solid line), one obtains the bending rigidity following EquationEq. (1)(1) . Adapted from supplementary material of [Citation51]. (b) Relaxation of GUVs exposed to a DC pulse. Upper panel: The shape factor
is shown in real time for 8 different vesicles denoted by different colors; time zero corresponds to the end of the DC pulse. The insert shows a sketch of a GUV deformed into a prolate ellipsoid and the two vesicle semi axes
and
(the field direction is along
). Lower panel: Time normalization (by
see text and [Citation58] for notations) and translation by a constant leads to collapse of the data form all 8 vesicles. The solid curve is the theoretical prediction in [Citation58]. The bending rigidity is calculated from the intial part of the relaxation curve, also referred to as ‘entropic’ regime. Reprinted with permission from [Citation58] Copyright (2015) by the American Physical Society.
![Figure 1. Membrane bending rigidity obtained from different types of vesicle electromanipulation. (a) Electrodeformation of giant vesicles subjected to an AC field. Upper panel: Phase contrast images of a GUV at 300 kHz and field amplitudes of 2, 10 and 20 kV/m (left to right). The scale bar corresponds to 25 µm. Reproduced from [Citation40]. Lower panel: Change in the area of a GUV as a function of increasing electric field strength (the field strength is in V/m, and the curvatures in 1/m). From the slope of the data (solid line), one obtains the bending rigidity following EquationEq. (1)(1) . Adapted from supplementary material of [Citation51]. (b) Relaxation of GUVs exposed to a DC pulse. Upper panel: The shape factor is shown in real time for 8 different vesicles denoted by different colors; time zero corresponds to the end of the DC pulse. The insert shows a sketch of a GUV deformed into a prolate ellipsoid and the two vesicle semi axes and (the field direction is along ). Lower panel: Time normalization (by see text and [Citation58] for notations) and translation by a constant leads to collapse of the data form all 8 vesicles. The solid curve is the theoretical prediction in [Citation58]. The bending rigidity is calculated from the intial part of the relaxation curve, also referred to as ‘entropic’ regime. Reprinted with permission from [Citation58] Copyright (2015) by the American Physical Society.](/cms/asset/c913cfd7-0d5e-4992-83ef-3c663f934364/tapx_a_2125342_f0001_oc.jpg)
Figure 2. Pore edge tension analysis. (a) Response of a POPC GUV exposed to a DC pulse (3 kV/cm, 150 μs). Macropores are first visualized in the third frame. The field direction is illustrated with a white arrow. The scale bar is 10 µm. Reproduced from [Citation59]. (b) Characterization of the porated region time dependence of another vesicle shown in the insert (phase contrast image and binarized image of the right vesicle half). The red open circles show experimental data. The solid line is a linear fit and the edge tension is deduced from its slope following the dependence in EquationEq. (2)(2) . Adapted from Biophys. J., 99, T. Portet and R. Dimova,A new method for measuring edge tensions and stability of lipid bilayers: effect of membrane composition, pp. 3264–3273, Copyright (2010), with permission from Elsevier. (c) Main window of the pore edge tension analysis software PoET illustrating the experimental setting and a processed video in the left panel with detected pore rim and indicated pore diameter. Reproduced from [Citation61].
![Figure 2. Pore edge tension analysis. (a) Response of a POPC GUV exposed to a DC pulse (3 kV/cm, 150 μs). Macropores are first visualized in the third frame. The field direction is illustrated with a white arrow. The scale bar is 10 µm. Reproduced from [Citation59]. (b) Characterization of the porated region time dependence of another vesicle shown in the insert (phase contrast image and binarized image of the right vesicle half). The red open circles show experimental data. The solid line is a linear fit and the edge tension is deduced from its slope following the dependence in EquationEq. (2)(2) . Adapted from Biophys. J., 99, T. Portet and R. Dimova,A new method for measuring edge tensions and stability of lipid bilayers: effect of membrane composition, pp. 3264–3273, Copyright (2010), with permission from Elsevier. (c) Main window of the pore edge tension analysis software PoET illustrating the experimental setting and a processed video in the left panel with detected pore rim and indicated pore diameter. Reproduced from [Citation61].](/cms/asset/8acbe374-3365-4c1e-832d-222529325f41/tapx_a_2125342_f0002_oc.jpg)
Figure 3. Electrodeformation of GUVs to measure membrane capacitance. (a) Frequency-dependent deformation of a POPC vesicle exposed to a uniform AC electric field at kV/m. The critical frequency
is used to determine the membrane capacitance from EquationEq. (3)
(3) . (b) Area strain dependence on the applied electric field strength for the same vesicle in (A) at a fixed frequency 0.2 kHz. The size of the vesicle is
26
m and the conductivity ratio is
. The electric field amplitude is changed from 2 to 10 kV/m in steps of 0.25 kV/m. The obtained bending rigidity is 12.67
. (c) Area strain dependence on the applied field frequency at a fixed field strength 6 kV/m. The expression of the electric stress
can be found in [Citation45]. The data is fitted in the prolate regime,
, from panel (A). The obtained bending rigidity is 14.97
. Reproduced from [Citation45] by permission of John Wiley and Sons.
![Figure 3. Electrodeformation of GUVs to measure membrane capacitance. (a) Frequency-dependent deformation of a POPC vesicle exposed to a uniform AC electric field at kV/m. The critical frequency is used to determine the membrane capacitance from EquationEq. (3)(3) . (b) Area strain dependence on the applied electric field strength for the same vesicle in (A) at a fixed frequency 0.2 kHz. The size of the vesicle is 26 m and the conductivity ratio is . The electric field amplitude is changed from 2 to 10 kV/m in steps of 0.25 kV/m. The obtained bending rigidity is 12.67 . (c) Area strain dependence on the applied field frequency at a fixed field strength 6 kV/m. The expression of the electric stress can be found in [Citation45]. The data is fitted in the prolate regime, , from panel (A). The obtained bending rigidity is 14.97 . Reproduced from [Citation45] by permission of John Wiley and Sons.](/cms/asset/108eb3ba-2e1e-4ad2-b0ae-52b37fe17369/tapx_a_2125342_f0003_oc.jpg)
Figure 4. Electrodeformation of GUVs as a method to measure membrane viscosity. (a) A uniform AC electric field deforms a GUV into a prolate ellipsoid as shown by the evolution of the aspect ratio Here, time zero refers to turning on the field. The inset shows that repeated deformation of the same GUV does not alter the membrane structure. (b) Vesicles made of different composition (DOPC, POPC, and diblock-copolymer) deform at a different rate revealing different shear viscosities; the field strength and frequency are 8 kV/m and 1 kHz. (c) Viscosity measured at different frequencies at a fixed field strength. Extrapolation to the vertical intercept yields the zero-frequency shear viscosity corresponding to the viscosity in the absence of field. Reprinted from Biophys. J. 121, H.A. Faizi, R. Dimova, P.M. Vlahovska, A vesicle microrheometer for high-throughput viscosity measurements of lipid and polymer membranes, pp. 910–918 Copyright (2022), with permission from Elsevier.
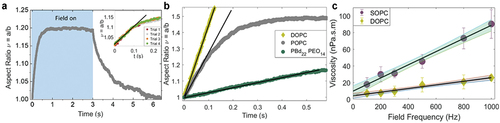
Figure 5. Vesicle electrodeformation and assessment of hidden area stored in membrane fluctuations. (a,b) Modulating vesicle adhesion by DC field. Confocal vertical cross sections of a non-adhering (a) and adhered (b) GUV (green). The scale bar represents 20 µm. Upon switching on the field, the vesicle adheres to the electrode (red) viewed in reflection. White arrows point to the contact curvature (left arrows) and membrane undulations (right). Undulations get suppressed after applying the DC field (1 V) in panel (b). (a,b) Reprinted from Biophys. J. 111, J. Steinkühler, J. Agudo-Canalejo, R. Lipowsky and R. Dimova, Modulating vesicle adhesion by electric fields, pp. 1454–1464, Copyright (2016), with permission from Elsevier [Citation88]. (c) Area increase and budding of a vesicle caused by photo-isomerization of an azo-benzene derivative (F-azo) incorporating in the membrane upon UV-light irradiation (purple region in graph). The area increase is assessed from simultaneous application of an AC field (10 kV/m, 1 MHz). Phase contrast images and degree of deformation plots over time are shown for 0.25 mM F-azo. The time stamps are indicated on the images upper left corners; 0 corresponds to turning the field on. The UV irradiation (violet region in the plot) starts after 7.1 s (). The scale bar is 10 μm. Reproduced from [Citation83]. (d-f) GUV area increase caused by insertion of Triton TX-100 just before membrane solubilization. Phase contrast sequences of POPC (d) and POPC/cholesterol (e) GUVs under an AC field (20 kV/m, 200 kHz) after addition of an aliquot of a concentrated Triton X-100 solution (80 mM). Scale bars are 10 μm. (f) Relative area increase (ΔA/A0) measured from the maximum aspect ratio using EquationEq. (5)
(5) displayed by the vesicle before contrast loss and membrane solubilization. Each data point represents one GUV. Mean values with standard deviation are shown in green. (d-f) Adapted with permission from Langmuir, 31, 378–386, B. Mattei, A.D.C. França, K.A. Riske,Solubilization of Binary Lipid Mixtures by the Detergent Triton X-100: The Role of Cholesterol. Copyright 2015 American Chemical Society.
![Figure 5. Vesicle electrodeformation and assessment of hidden area stored in membrane fluctuations. (a,b) Modulating vesicle adhesion by DC field. Confocal vertical cross sections of a non-adhering (a) and adhered (b) GUV (green). The scale bar represents 20 µm. Upon switching on the field, the vesicle adheres to the electrode (red) viewed in reflection. White arrows point to the contact curvature (left arrows) and membrane undulations (right). Undulations get suppressed after applying the DC field (1 V) in panel (b). (a,b) Reprinted from Biophys. J. 111, J. Steinkühler, J. Agudo-Canalejo, R. Lipowsky and R. Dimova, Modulating vesicle adhesion by electric fields, pp. 1454–1464, Copyright (2016), with permission from Elsevier [Citation88]. (c) Area increase and budding of a vesicle caused by photo-isomerization of an azo-benzene derivative (F-azo) incorporating in the membrane upon UV-light irradiation (purple region in graph). The area increase is assessed from simultaneous application of an AC field (10 kV/m, 1 MHz). Phase contrast images and degree of deformation plots over time are shown for 0.25 mM F-azo. The time stamps are indicated on the images upper left corners; 0 corresponds to turning the field on. The UV irradiation (violet region in the plot) starts after 7.1 s (image 2A). The scale bar is 10 μm. Reproduced from [Citation83]. (d-f) GUV area increase caused by insertion of Triton TX-100 just before membrane solubilization. Phase contrast sequences of POPC (d) and POPC/cholesterol (e) GUVs under an AC field (20 kV/m, 200 kHz) after addition of an aliquot of a concentrated Triton X-100 solution (80 mM). Scale bars are 10 μm. (f) Relative area increase (ΔA/A0) measured from the maximum aspect ratio using EquationEq. (5)(5) displayed by the vesicle before contrast loss and membrane solubilization. Each data point represents one GUV. Mean values with standard deviation are shown in green. (d-f) Adapted with permission from Langmuir, 31, 378–386, B. Mattei, A.D.C. França, K.A. Riske,Solubilization of Binary Lipid Mixtures by the Detergent Triton X-100: The Role of Cholesterol. Copyright 2015 American Chemical Society.](/cms/asset/c29a3ffc-6f91-40e8-8870-1141ff67cbd2/tapx_a_2125342_f0005_oc.jpg)
Figure 6. Evaluation of membrane stability through electroporation and electropermeabilization. Examples of bursting vesicles observed under phase contrast (a) and epifluorescence (b) microscopy. (c) Phase-contrast images of an electropermeabilized vesicle showing macropore closure but loss of optical contrast over time because of remaining submicroscopic pores. The GUVs were subjected to a DC pulse (300 kV/m, 150 μs). The field direction is indicated with an arrow. The scale bars are 10 µm. The time relative to the beginning of the pulse is shown on each snapshot. (a,b and c) are reproduced from [Citation60]. (d) Differential interference contrast (a, d) and confocal (b, c, e, f) images of vesicles forming cracks and wrinkles (folds) after exposure to a DC pulse (600 kV/m, 300 μs). The folds and cracks are indicated with arrows. The electrode polarity is indicated with a plus and a minus sign in (a). Images are reproduced from [Citation107].
![Figure 6. Evaluation of membrane stability through electroporation and electropermeabilization. Examples of bursting vesicles observed under phase contrast (a) and epifluorescence (b) microscopy. (c) Phase-contrast images of an electropermeabilized vesicle showing macropore closure but loss of optical contrast over time because of remaining submicroscopic pores. The GUVs were subjected to a DC pulse (300 kV/m, 150 μs). The field direction is indicated with an arrow. The scale bars are 10 µm. The time relative to the beginning of the pulse is shown on each snapshot. (a,b and c) are reproduced from [Citation60]. (d) Differential interference contrast (a, d) and confocal (b, c, e, f) images of vesicles forming cracks and wrinkles (folds) after exposure to a DC pulse (600 kV/m, 300 μs). The folds and cracks are indicated with arrows. The electrode polarity is indicated with a plus and a minus sign in (a). Images are reproduced from [Citation107].](/cms/asset/57d084f8-4a7c-4cc8-926e-4756fc0e38bd/tapx_a_2125342_f0006_b.gif)
Figure 7. Electropermeabilization monitored with different approaches. (a) GUV internalization of dyes introduced at different times (before pulse, t ≈ 0, and 5–10 min after macropore resealing) reveals three types of vesicle response (membrane in red): pores reseal (no permeation; first column), short-living pores reseal within 1–2 minutes (middle column) and long-living pores persist (last column). Calcein (green) is added prior to poration (time ≈ 0, upper row) and shows the immediate dye permeation occurring in the first 1–2 min after the pulse as well as long-term permeability in the presence of long-living pores (last column). Atto-647 (cyan, lower row) is added 5–10 min after electroporation and reports the presence of long-lived pores only (last column). Scale bars: 20 µm. Reproduced from [Citation60]. (b) Electropermeabilization of a GUV imaged under CARS microscopy. Images N = 1, 10, 20 and 30 are part of a time series acquired with an interval between each image of 310 ms. White arrows indicate nanotubes shed from the GUVs upon electropermeabilization. The yellow arrow indicates the electric field direction. The scale bar is 10 µm. (b) Reprinted from Bioelectrochemistry, 87, C. Mauroy, T. Portet, M. Winterhalder, E. Bellard, M.-C. Blache, J. Teissié, A. Zumbusch, M.-P. Rols, Giant lipid vesicles under electric field pulses assessed by non invasive imaging, pp. 253–259, Copyright (2012), with permission from Elsevier.
![Figure 7. Electropermeabilization monitored with different approaches. (a) GUV internalization of dyes introduced at different times (before pulse, t ≈ 0, and 5–10 min after macropore resealing) reveals three types of vesicle response (membrane in red): pores reseal (no permeation; first column), short-living pores reseal within 1–2 minutes (middle column) and long-living pores persist (last column). Calcein (green) is added prior to poration (time ≈ 0, upper row) and shows the immediate dye permeation occurring in the first 1–2 min after the pulse as well as long-term permeability in the presence of long-living pores (last column). Atto-647 (cyan, lower row) is added 5–10 min after electroporation and reports the presence of long-lived pores only (last column). Scale bars: 20 µm. Reproduced from [Citation60]. (b) Electropermeabilization of a GUV imaged under CARS microscopy. Images N = 1, 10, 20 and 30 are part of a time series acquired with an interval between each image of 310 ms. White arrows indicate nanotubes shed from the GUVs upon electropermeabilization. The yellow arrow indicates the electric field direction. The scale bar is 10 µm. (b) Reprinted from Bioelectrochemistry, 87, C. Mauroy, T. Portet, M. Winterhalder, E. Bellard, M.-C. Blache, J. Teissié, A. Zumbusch, M.-P. Rols, Giant lipid vesicles under electric field pulses assessed by non invasive imaging, pp. 253–259, Copyright (2012), with permission from Elsevier.](/cms/asset/23f1b45c-0b02-4a75-95d0-1bc83eff6830/tapx_a_2125342_f0007_oc.jpg)
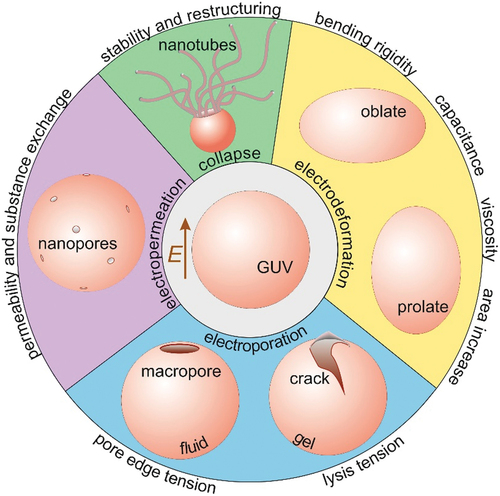
Figure 8. An overview of the spectrum of techniques for assessing membrane material properties and characteristics from exposing giant GUVs to elelctric fields as reviewed in this work: bending rigidity, capacitance, membrane surface shear viscosity, area stored in fluctuations, lysis tension, pore edge tension, permeability and stability after poration.