
Figures & data
Figure 1. Summary of the development of the BRE Healthy Cities Index 2012 – 2018 (note numbers in brackets are referred to in the main text to orient the reader).
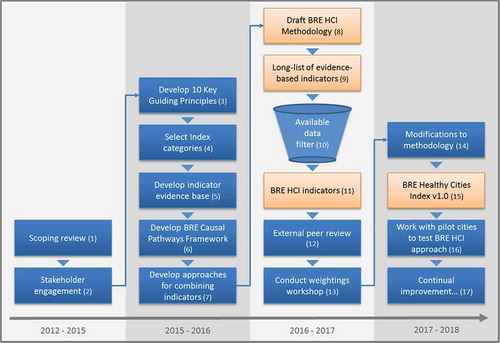
Table 1. Ten key principles to guide development of the BRE Healthy Cities Index.
Table 2. Ten categories in the BRE Healthy Cities Index.
Table 3. Excerpt from the Housing & Buildings category evidence base for the BRE Healthy Cities Index (note H2 and HP3 are identifiers for indicators within this category, described more explicitly in ).
Table 4. Categories (10) and indicators (58) in the BRE Healthy Cities Index (note an asterisk denotes indicators for which we have identified data and the obelisk symbol denotes indicators also reported in BS ISO 37120).
Table 5. BRE Healthy Cities Index Housing & Buildings category indicator data (standardised and un-standardised) and final category scores (note -/+ in brackets indicates whether the indicator is positively or negatively correlated with health and wellbeing outcomes).
Figure 2. BRE Causal Pathways Framework (copyright BRE, reproduced with permission).
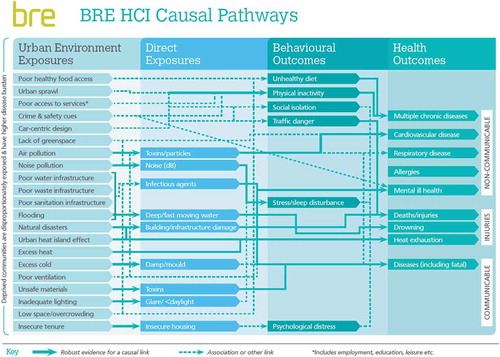
Table 1 Seven characteristics of complex systems used in proposed Complexity Rating