Figures & data
Figure 2. Map of the walking routes undertaken by participants (walking in one of six possible scenarios). UQ – Urban quiet; UB – Urban busy; UG – Urban green.
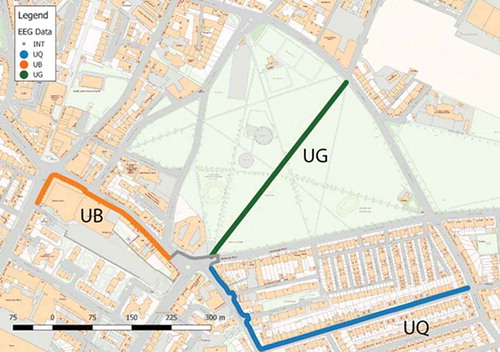
Figure 3. Street views of the three walking environments; (a) Urban green (b) Urban busy and (c) Urban quiet (Photo credit: OPENspace Research Centre).
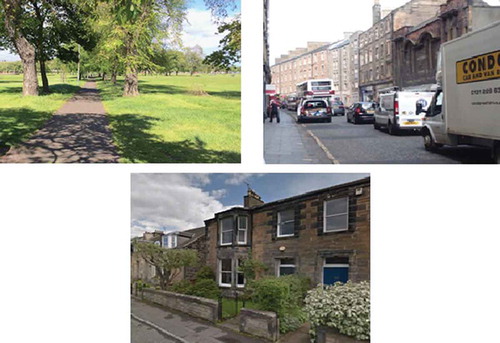
Table 1. Descriptions of the EEG signals of interest.
Table 2. Logistic CCR outputs for the UB and UG routes.
Figure 4. Alpha and low beta difference scores for each walking context.
Note: A positive value above zero indicates levels for that parameter are greater in the first part of the walk and a negative value below zero indicates levels for that parameter are greater in the second part of the walk.

Table 3. Logistic CCR outputs for the UB and UQ routes.
Figure 5. Alpha difference scores for each walking condition showing that alpha is greater in the UB setting than the UQ setting.
Note: A positive value above zero indicates levels for that parameter are greater in the first part of the walk and a negative value below zero indicates levels for that parameter are greater in the second part of the walk.
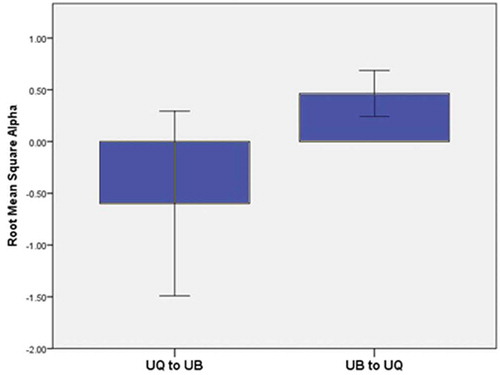
Table 4. Logistic CCR outputs for the UG and UQ routes.
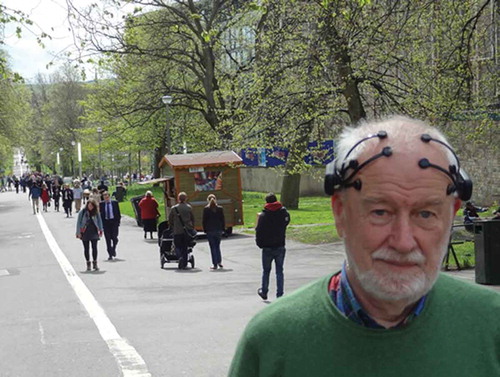
Figure 1. A demonstration of the headset being worn.