
Figures & data
Figure 1. Overview of the methodology
Table 1. Settlement types in Delhi, from (Government of National Capital Territory of Delhi Citation2008)
Figure 2. Examples of category 1: planned housing (top left), category 2: urban/rural villages (top right), category 3: unauthorised housing (bottom left), and category 4: JJ Clusters (bottom right)
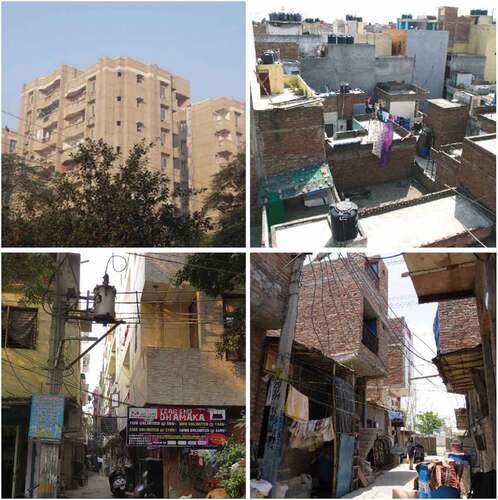
Table 2. Typical properties of each settlement type
Table 3. Assumptions on energy use in dwellings
Table 4. Hazards assessed in the Delhi housing stock (from UK HHSRS apart from those marked * which were added for the Delhi stock)
Table 5. Risk matrix used to assess each hazard based on the likelihood of occurrence and spread of harm
Table 6. Annual energy use by end-use (and percentages) by settlement type
Figure 3. Estimated kg CO2 emissions per household by settlement type
Figure 4. Comparison of electrical energy use estimates with other studies in literature in composite climate
Table 7. Estimated household health hazard risks final rating (SO,H), with red denoting highest risk hazards and green lowest risk hazards (with modal responses of Low, Medium, High and Severe for the likelihood of occurrence, O, and expected harm, H, noted in subscript)
Table A1. Sensitivity analysis input distribution and coefficients for energy use variables
Table C1. Exposure risk, housing modifiers/conditions and available health evidence used to estimate the likelihood of harm and expected harm