
Figures & data
Table 1. Examples of Bangkok liveability concepts, indicators, data sources used, and alignment to SDG targets
Figure 1. Measuring, monitoring and translating liveability in Bangkok: project structure
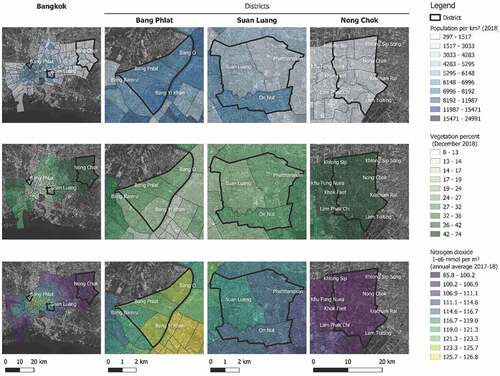
Figure 2. Examples of static maps prepared for three case study sites in Bangkok
Supplemental Material
Download MS Word (24.7 KB)Data availability statement
Publicly available data utilised to produce the results presented in this paper have been referenced accordingly. Some of the data that support the findings of this study are available from the Bangkok Metropolitan Administration but restrictions apply to the availability of these data, which were used under license for the current study, and so are not publicly available. Data are however available from the authors upon reasonable request and with permission of the Bangkok Metropolitan Administration.