
Figures & data
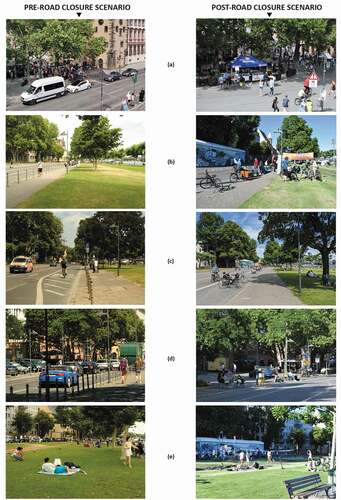
Figure 1. Immediate areas in close vicinity to Mainkai; A: Overlooking Mainkai street and riverside pathway from pedestrian bridge i.e. Eiserner Steg (post road closure)
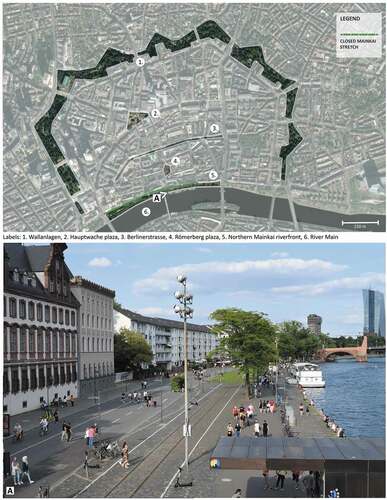
Figure 2. Pedestrianized Mainkai street on the northern Main riverfront in Frankfurt
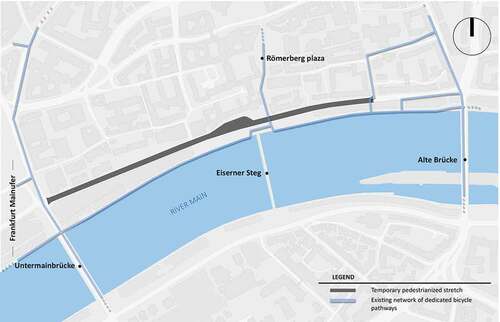
Figure 3. Observation areas in Mainkai through respective methodological perspective
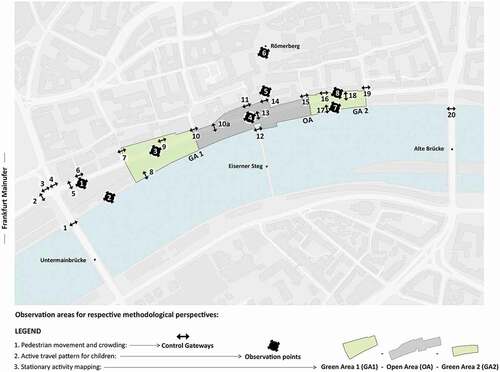
Figure 4. Different observation areas for studying mobility patterns of children i.e. on Römer plaza (a), Mainkai street (b and e), Main riverfront promenade (c), and crossing at Eiserner Steg (d)
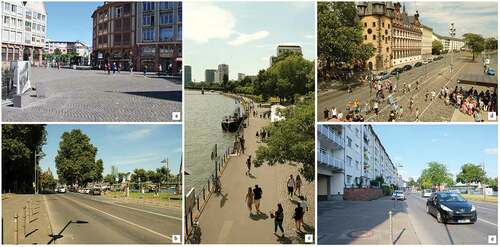
Figure 5. Peak hour crowding (in ppmm) on a weekend (evening hours) along selected control gateways before and after road closure
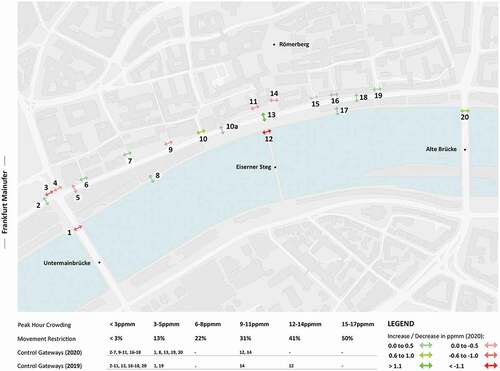
Table 1. Overall frequency (weekly) trend during peak hours among user-groups through selected gateways on northern Mainkai riverfront, 2019-2020.’ is currently missing in this document
Figure 6. Percentage change in the peak hour frequency of user-groups on (a) all Gateways, (b) Mainkai street, (c) Mainkai riverside, and (d) Bridges during post-road closure scenario
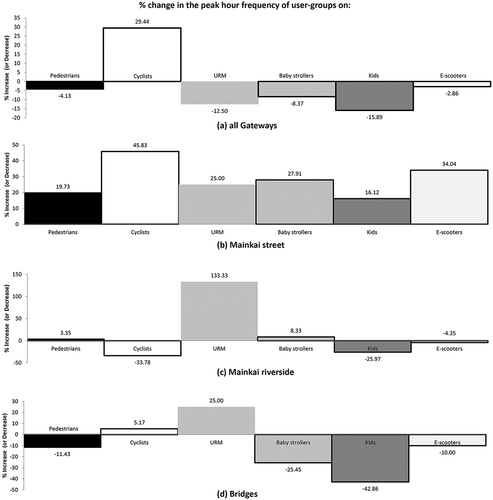
Figure 7. Comparison of total cases of children walking (a) and cycling (b) during pre-and post road closure scenario
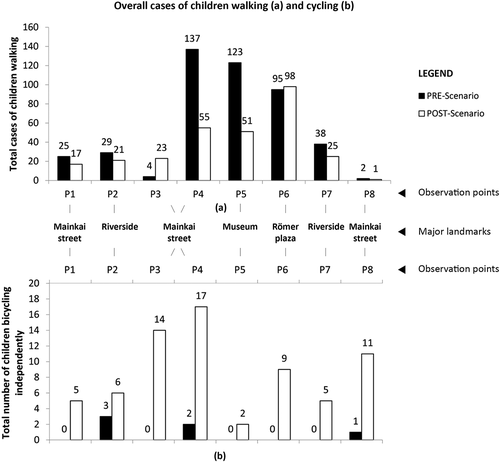
Figure 8. Representation of overall children walking and cycling during pre-and post-road closure scenario
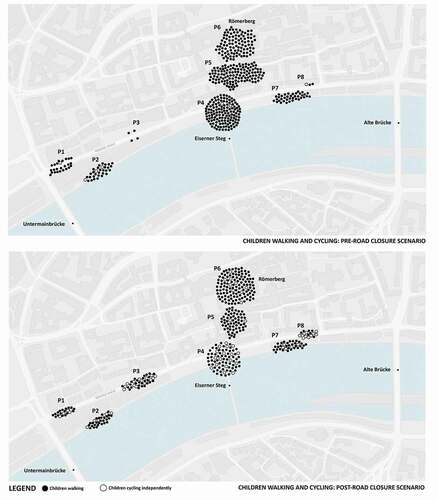
Figure 9. Activity distribution during pre-and post-road closure scenario on a weekend (evening hours)
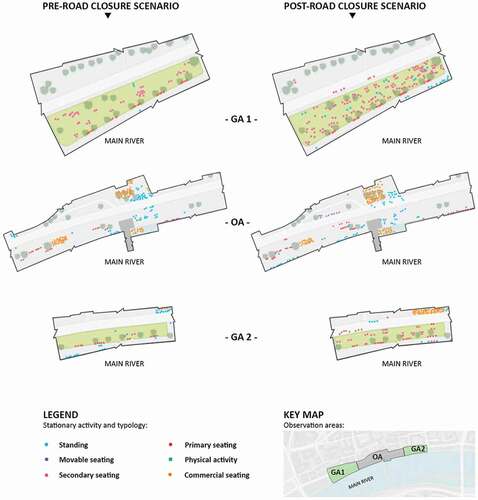
Figure 10. Comparison of space usage, during pre-and post-road closure scenarios on Mainkai street (at similar time period of the day)
Data availability statement
The data that support the findings of this study are openly available in TU Darmstadt's research data repository at https://tudatalib.ulb.tu-darmstadt.de/handle/tudatalib/2416.2.