Figures & data
Table 1. Demographic characteristics and sanitation services of participants (n = 258).
Figure 1. Combinations of menstrual absorbents used by participants at their last period (n = 258).
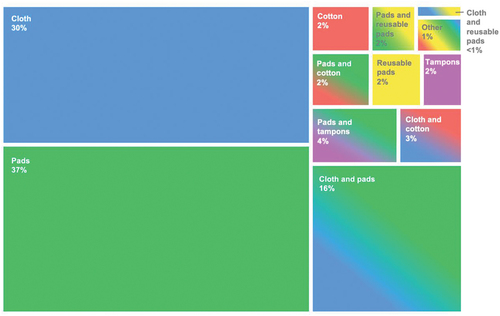
Figure 2. Number of pads discarded during last period by survey participants who just use pads (n = 94).
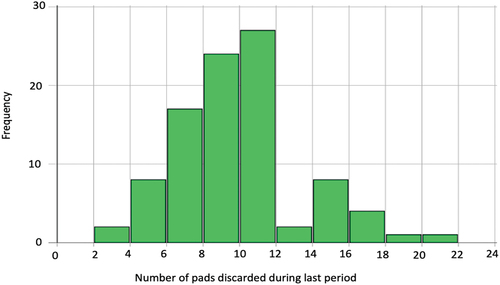
Figure 3. Number of menstrual cloths discarded over the last year by survey participants who just use cloth (n = 55).
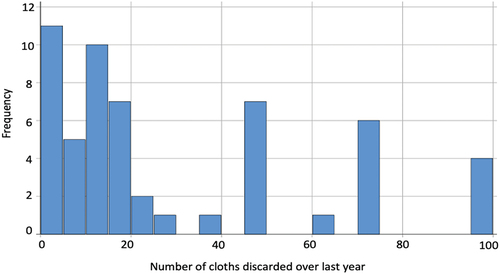
Figure 4. Composition and known/anticipated disposal pathways of participants’ (n = 258) menstrual absorbents at their last period. Disposal pathways for reusable menstrual absorbents (cloth, reusable pads) are estimated based on how participants most recently disposed of their cloth/reusable pads. Destinations for menstrual absorbents disposed in pit latrines, bins, and rubbish pits are estimated based on what participants anticipate will happen to these receptacles once they are full.
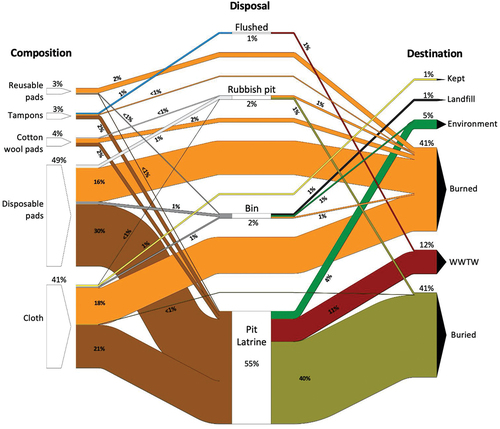
Table 2. Correlations of absorbent use and disposal choice with demographic/household infrastructure characteristics and recruitment location.
Table 3. Binomial logistic regression models for pad and cloth use.
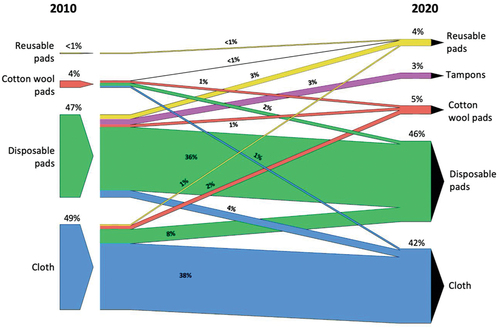
Figure 5. Menstrual absorbents used by sub-set of participants who experienced menstrual cycles at the time of the survey (2020) and 10 years prior (2010) (n = 190).