Figures & data
Figure 1. The population strategy of health. (Combined data used from Rose Citation1993, Cooper and Melton Citation1992)
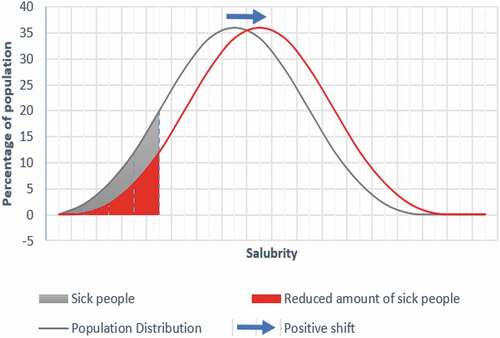
Figure 2. Age changes in skeletal calcium mass (Data from Riggs and Merton Citation1992, Henry et al. Citation2004)
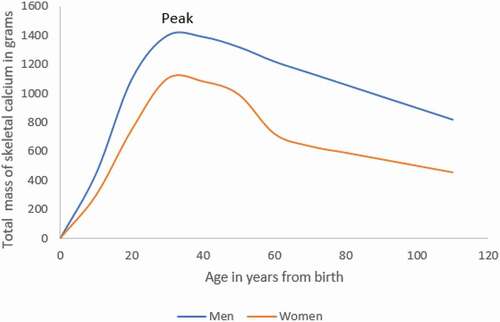
Figure 3. Schematic representation of the changes of bone mass with age. The grey line shows the theoretical consequence of a reduction in peak bone mass.(Data from (Ott Citation1990, Daly et al. Citation1999, Hernandez et al. Citation2003, Rizzoli et al. Citation2010, Anliker et al. Citation2012)
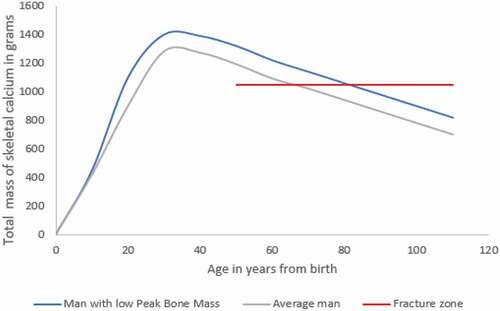
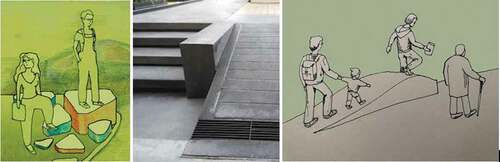
Figure 4. Child playing, Moorgate, London, 1946
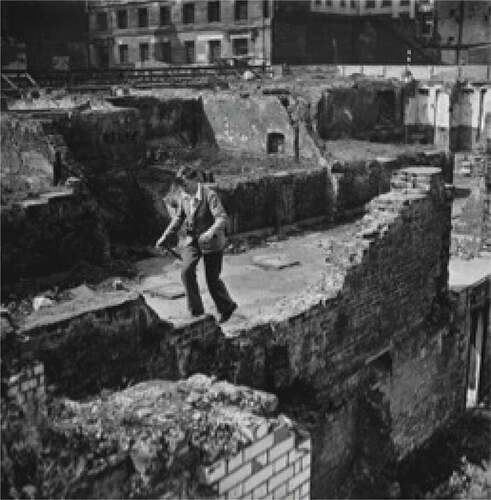
Table 1. Forces in 3 dimensions from stepping down and jumping down 385 mm - experimental data for 17 subjects
Figure 5. Observations of stepping down
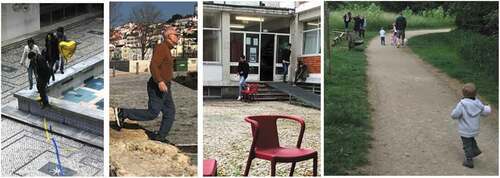
Figure 6. Routes from Packington bridge towards the Regent’s Canal sidewalk. London
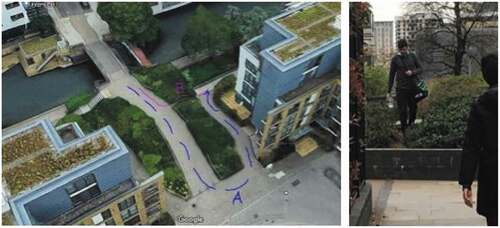
Figure 7. Kistler Force Plate 9260AA6 used in the experiment
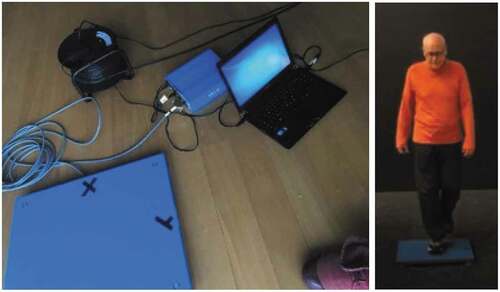
Figure 8. Ground reaction forces when walking horizontally and using stairs (Stacoff et al. Citation2005)
Figure 9. Step up, measurement: front leg and back leg. The character or load dynamics
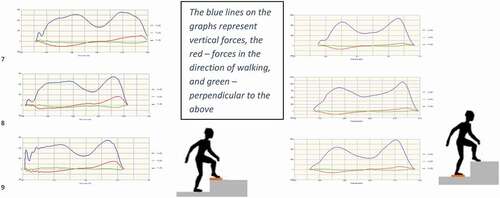
Figure 10. Step down, measurement: front leg. The character or load dynamics
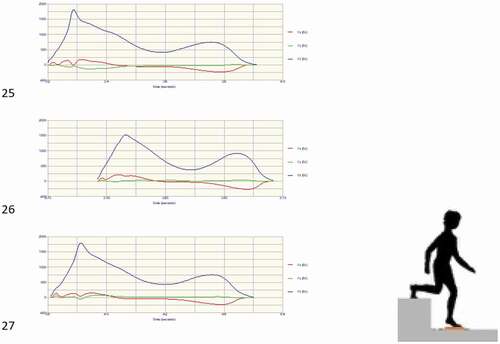
Figure 11. Jump down on force platform
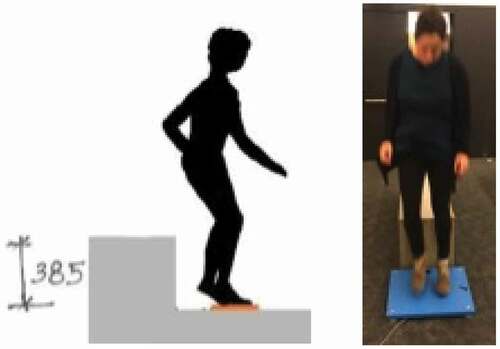
Figure 12. Forces in 3 dimensions from stepping down and jumping down 385 mm
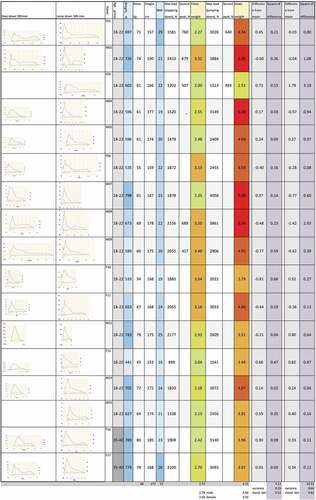
Figure 13. Potential Bone Mass Density changes before and after intervention
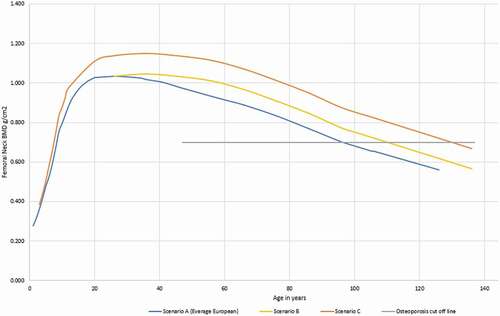
Figure 14. Age distribution of osteoporosis among women now and if postponed by 28 years
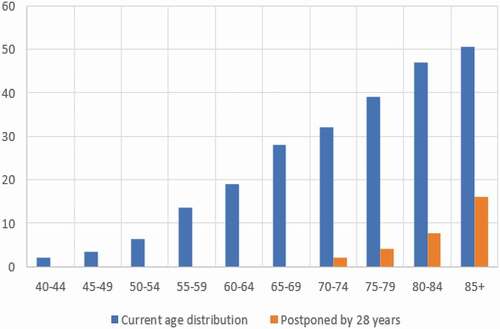
Figure 15. Entrance porch, Edinburgh. Possibility to step down on the side
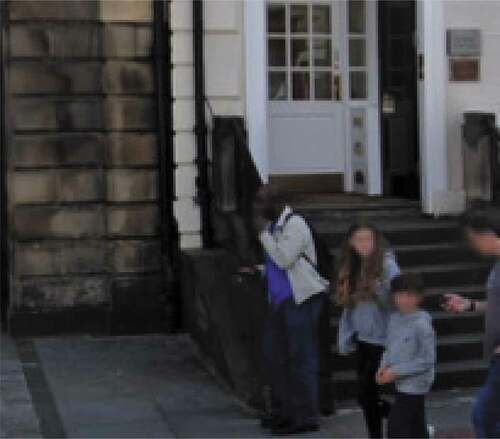
Figure 16. Retaining wall following natural terrain, Manchester. Possibility to shorten the route by stepping down
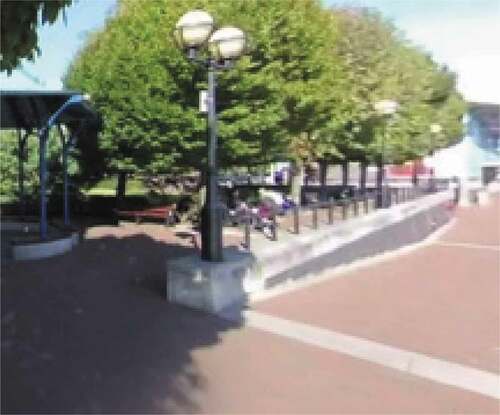
Figure 17. Artificial elevated landscape, London. Possibility to shorten the route by jumping down
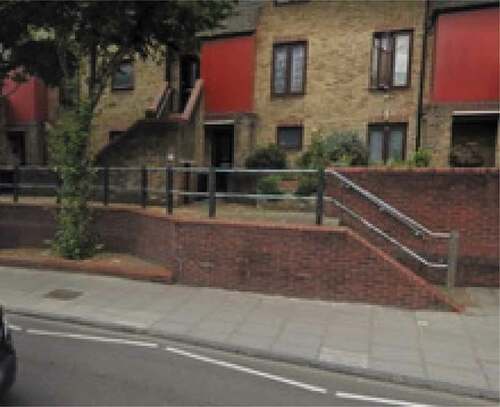
Figure 18. Riverside, Siegen, Germany. Possibility to choose between small and large steps
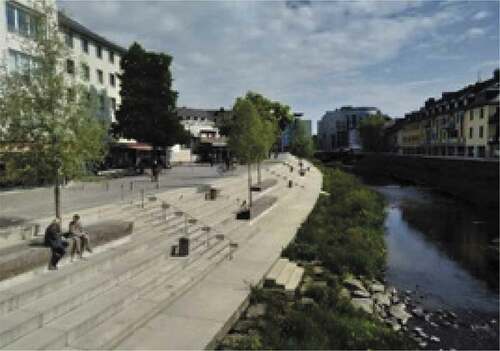
Figure 19. Kathmandu, Nepal. Possibility to choose between small and large steps
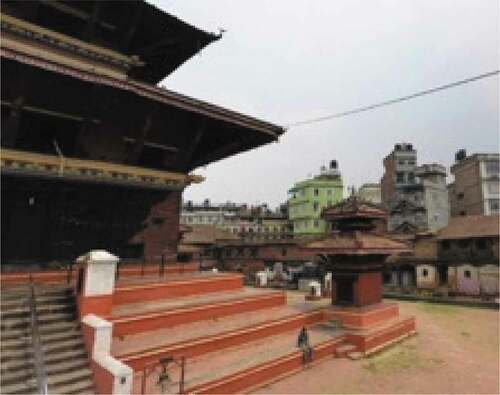
Figure 20. Queen Elizabeth Olympic Park. London. Possibility to choose between small and large steps
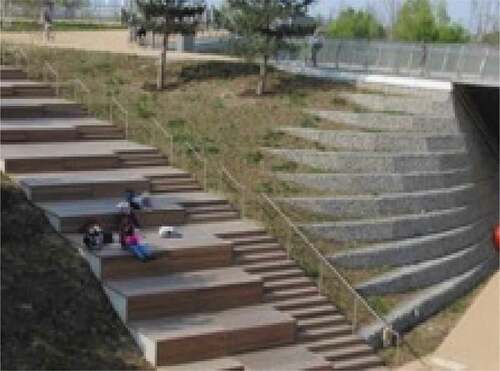
Figure 21. Sculpture near St. Paul’s Cathedral. London, UK
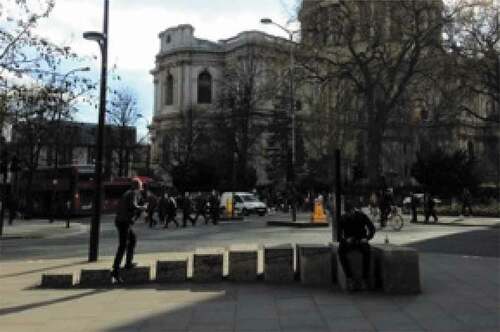
Figure 22. Examples of possible incorporation