
Figures & data
Table 1. Built environment variables description and calculation methods.
Table 2. Built environment characteristics of the Greater Melbourne area stratified by quintiles of socio-economic disadvantage.
Figure 1. Walkability and socio-economic disadvantage across the Greater Melbourne area.
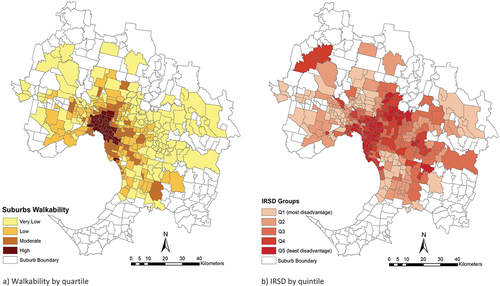
Table 3. Linear regression model results stratified by quintiles of socio-economic disadvantage1.
Table 4. Walkability premium/discount and percentage of change in price.
Supplemental material