Figures & data
Figure 1. Stages of SROI.

Table 1. Facilities included in the SROI.
Table 2. Summary of data collection for the SROI.
Figure 2. Impact Map: Part 1 – general participation.
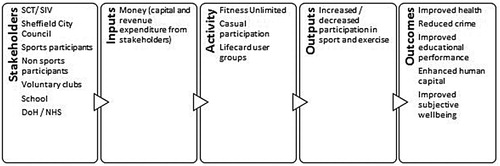
Table 3. Summary of inputs.
Table 4. Social outcomes valuation summary: Part 1.
Figure 3. Impact Map: Part 2 – PARS.
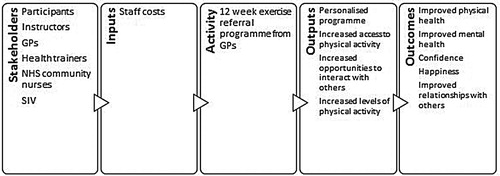
Figure 4. Outcome changes experienced by PARS participants.
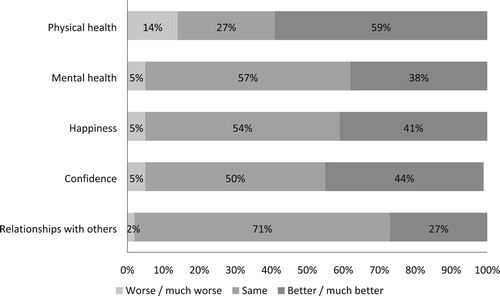
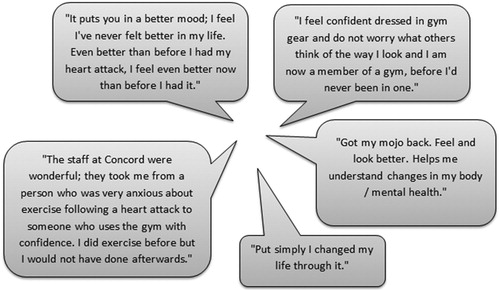
Figure 5. Individual benefits expressed by PARS participants.