
Figures & data
Table 1: Previous research on CB in football.
Figure 1. Median NHICB scores across various formats of international cricket.
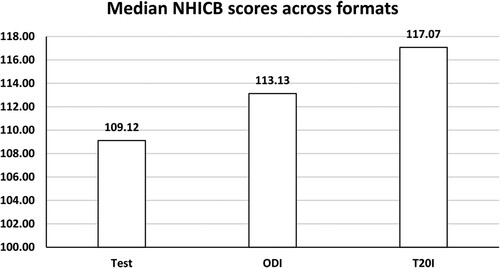
Figure 2. Average NHICB scores in different formats of international cricket across different time periods.
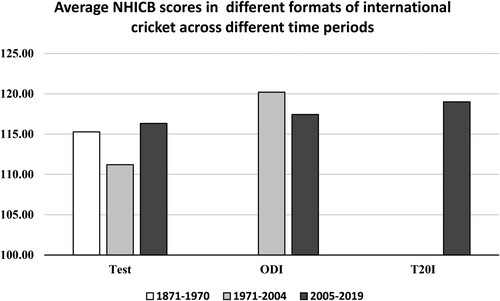
Table 2. Results for test of normality (Shapiro–Wilk test).
Table 3. Correlation between time trends and NHICB.
Table 4. Correlation between number of teams and NHICB.
Table 5. Impact of ODI on test cricket.
Table 6. Impact of T20I on test cricket.
Table 7. Impact of introduction of T20I cricket on ODI cricket.
Table 8. Measuring the evolution of competitive balance in international cricket.
Table A1. Number of teams to feature in international cricket across different decades.
Table A2. Overall results table of test cricket between 1877 and 2020 (for teams with more than 75 tests).
Table A3. Overall results table of ODI cricket between 1971 and 2020 (for teams with more than 50 ODIs).
Table A4. Overall results table of T20I cricket between 2005 and 2020 (for teams with more than 30 T20Is).