Figures & data
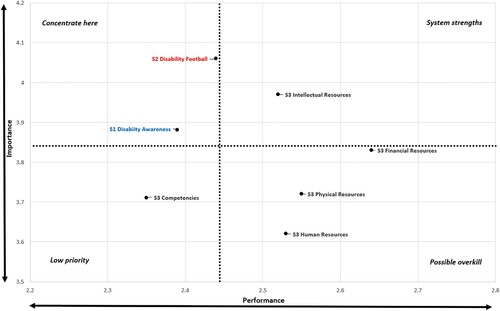
Figure 1. An Importance Performance Chart. Source: Adapted from Martilla and James (Citation1977).
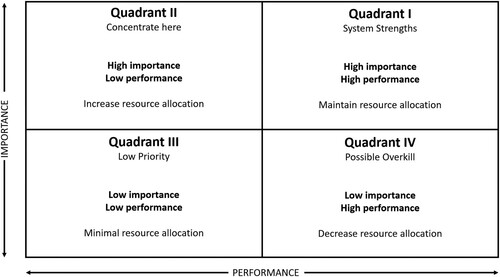
Figure 2. The UEFA region and respondent National Associations. Source: Authors adapted from mapchart.net.
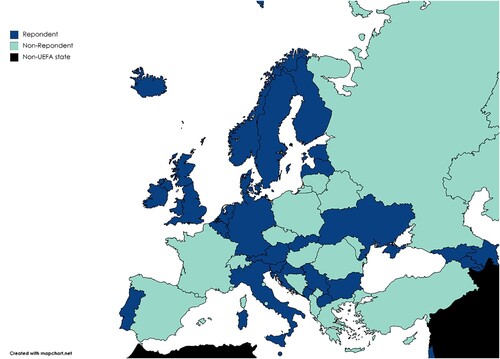
Table 1. The final survey indicators and items.
Table 2. Cronbach’s α coefficients of each indicator under study for the importance and performance scores.
Table 3. Statistics and effect sizes of the tests for the overall mean scores of importance and performance for the seven indicators under analysis.
Figure 3. Overall position of indicators in IPA chart. Source: Authors.