
Figures & data
Table 1. Descriptive statistics for key variables. N = 310.
Figure 1. Market value by player performance, with 95% CIs for regression lines. The FotMob market values are on the left-hand side; the Transfermarkt market values are on the right-hand side.
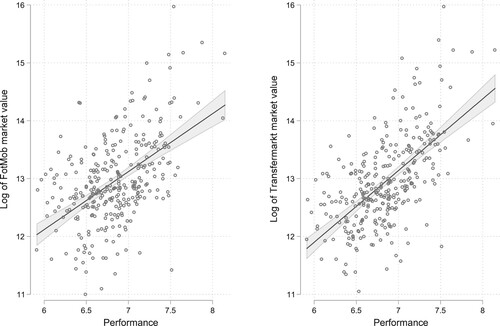
Table 2. Market values (logged) by player performance. OLS regression models. N = 310.
Figure 2. Market value by player performance for three levels of player experience.
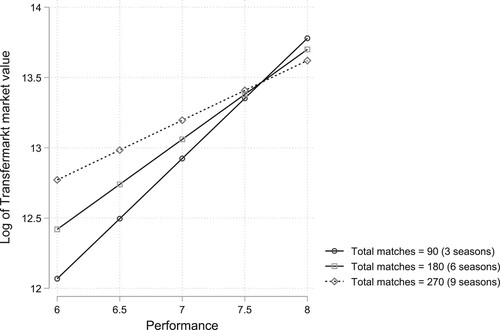
Figure 3. Market value by player performance for four player positions.
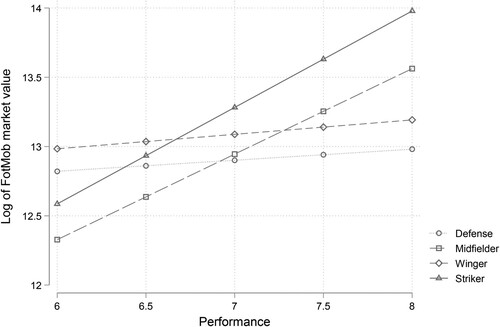
Figure 4. Market value by player performance for three different years of contract signing.
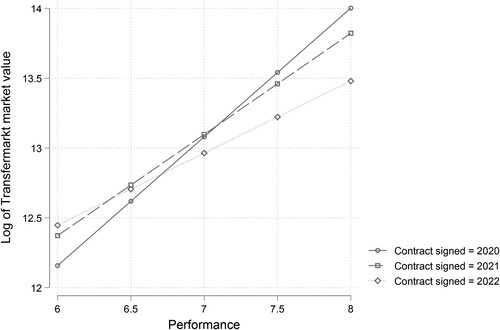
Figure 5. Average season player rating according to the journalists in VG by average player performance, with 95% CI for regression line.
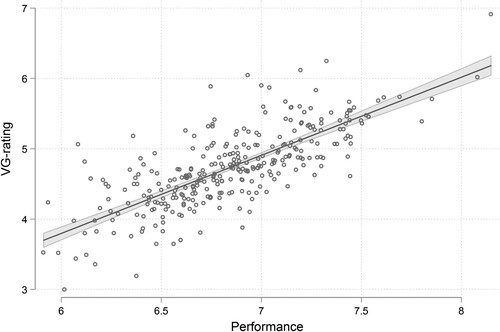
Table A1. Effects of control variables on Transfermarkt market values (logged) for Model D in Table 2. OLS regression. N = 310.