Figures & data
Figure 1. A comprehensive measurement and modelling framework.
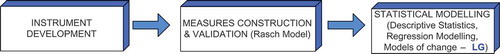
Figure 2. Distribution of students’ responses on the confidence items.
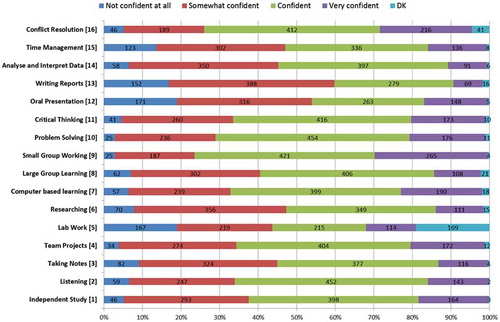
Table 1. Sample description, by gender and subject groups.
Table 2. Item measures and fit statistics for a potential construct of confidence in learning at HE.
Figure 3. Item measures by gender groups and indicators of significant DIF.
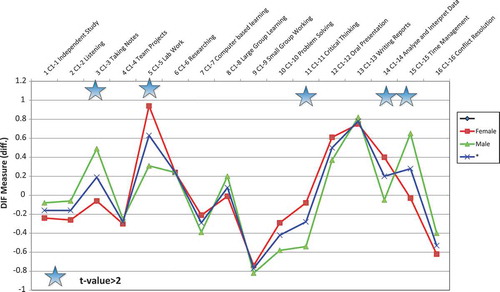
Figure 4. Item measures by year groups and indicators of significant DIF.
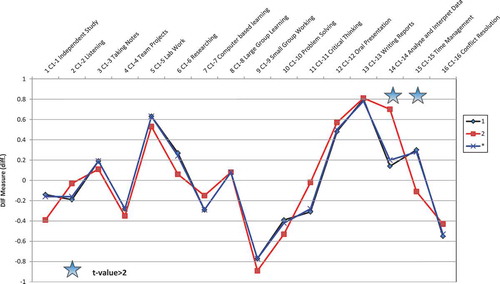
Table 3. Item measures and fit statistics for the three confidence subscales.
Figure 5. Person-item maps for the three confidence sub-measures.
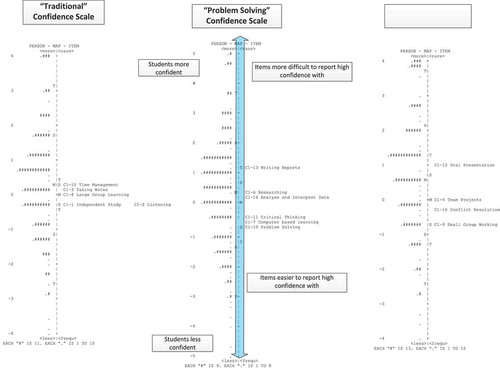
Figure 6. Category statistics and item characteristic curve (ICC) for the Traditional Confidence.
Figure 7. Item characteristic curves (ICC) for ‘Social’ (left) and ‘Problem Solving’ (right) confidence measures.
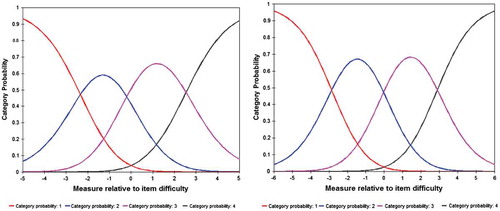
Table 4. Overview of constructed measures.
Figure 8. Histograms of measures of students’ dispositions and perceptions of transition.
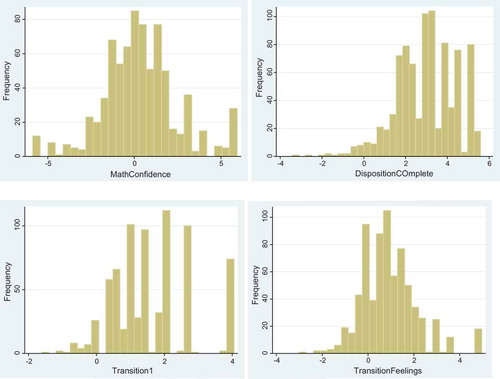
Figure 9. Means of gender groups on the confidence measures.
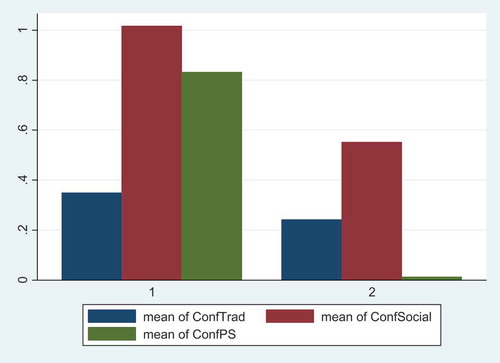
Table 5. Correlations between dispositions and confidence measures.
Table 6. Correlations between dispositions, confidence and attainment measures.
Table 7. Regression models for the confidence measures as outcome variables.
Table 8. Regression models for the learning gain (year 1 results as outcome).
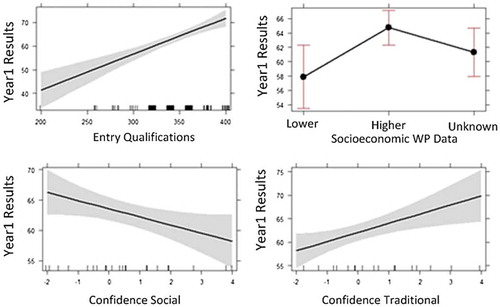
Figure 10. Effect plots for the significant relations of model LG3.