Figures & data
Table 1. Dioceses of the sample.
Table 2. Ratio of responses/priests to the questionnaire by diocese.
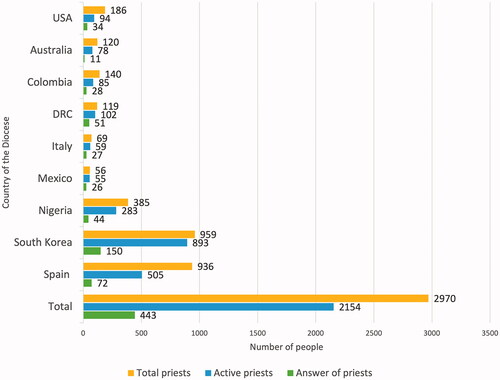
Graph 1. Distribution of priests’ answers by diocese.
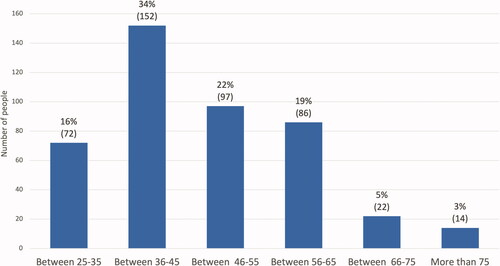
Graph 2. The age of the priests (443 responses).
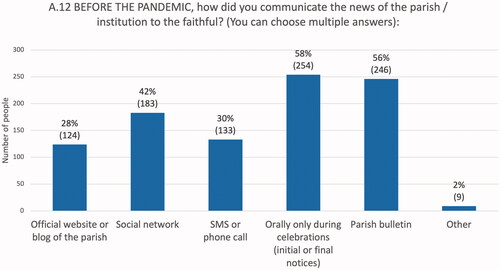
Graph 3. Pre-pandemic information channels with the faithful (437/443 responses, 99% response rate).
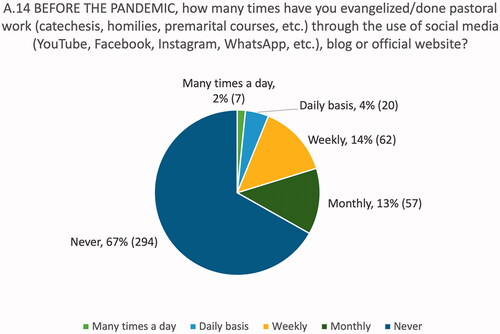
Graph 4. Use of social media for evangelization before the pandemic (440/443, 99%).
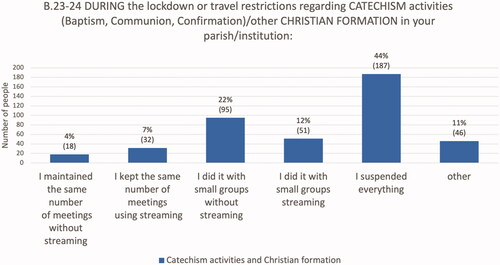
Graph 5. Catechism and other Christian formation activities during the first months of the pandemic (428/443, 97%).
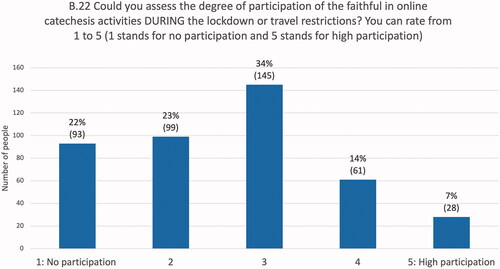
Graph 6. Participation of the faithful in online catechesis during the first months of the pandemic (426/443, 96%).
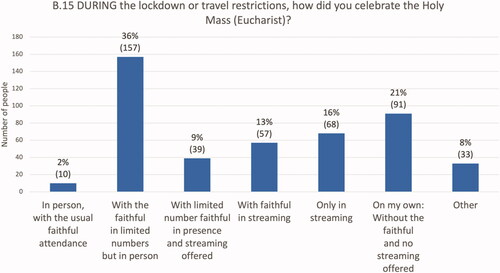
Graph 7. Modalities in the celebration of Mass during the first months of the pandemic (437/443, 99%).
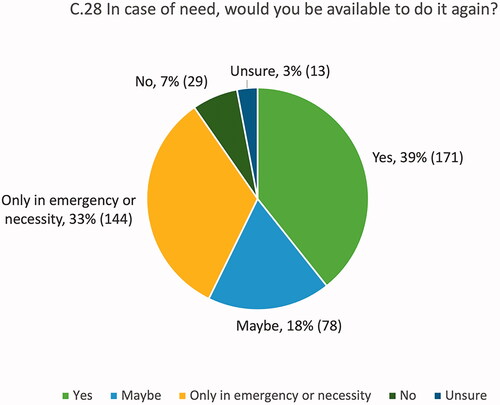
Graph 8. Future reuse of social media for the transmission of the masses (435/443, 98%).
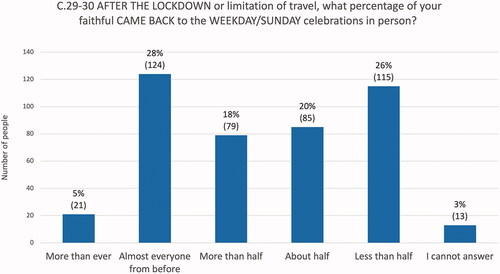
Graph 9. Number of faithful returned to church after the first months of the pandemic (Weekday & Sunday average: 435.5/443, 98%).
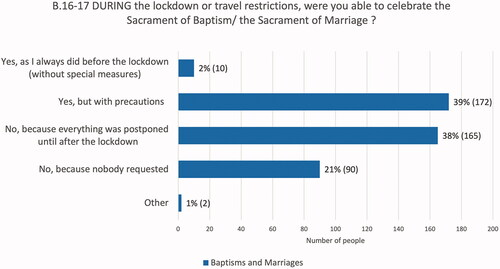
Graph 10. Baptisms and Marriages during the first months of the pandemic (438/443, 99%).
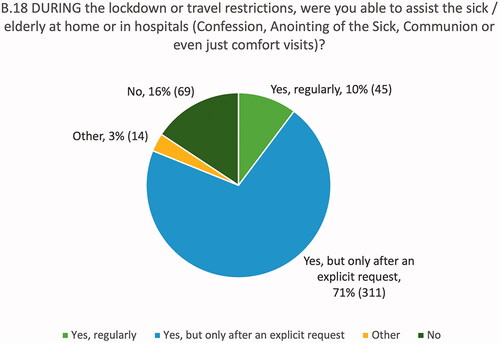
Graph 11. Spiritual assistance during the first months of the pandemic (439/443, 99%).
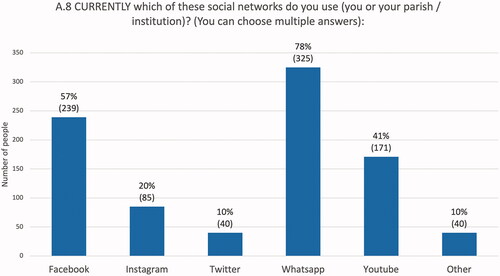
Graph 12. Priests’ social media channels (419/443, 95%).
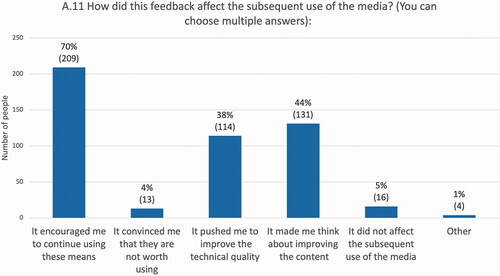
Graph 13. Influence of faithful’s feedback on priestly media use (297/443, 67%).
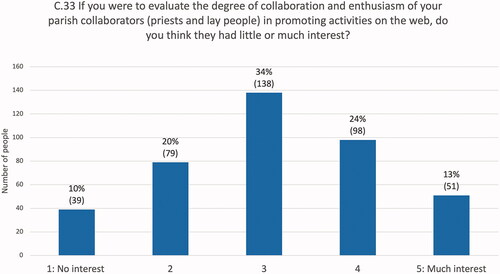
Graph 14. Level of interest of parish employees in online activities (405/443, 91%).
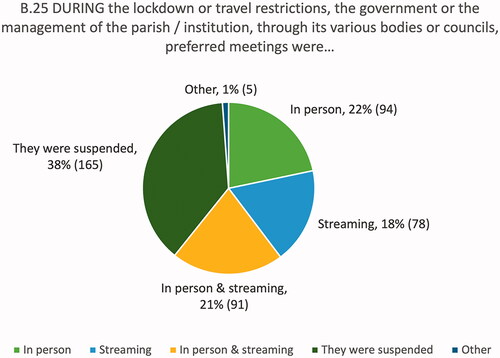
Graph 15. Parish meetings during the first months of the pandemic (433/443, 98%).
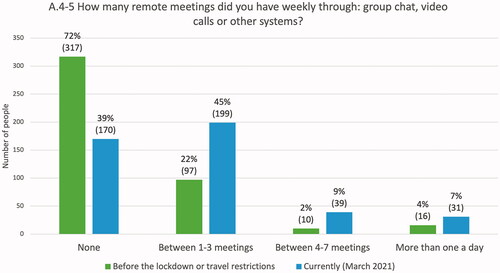
Graph 16. Number of weekly parish meetings before and during the pandemic (439/443, 99%).
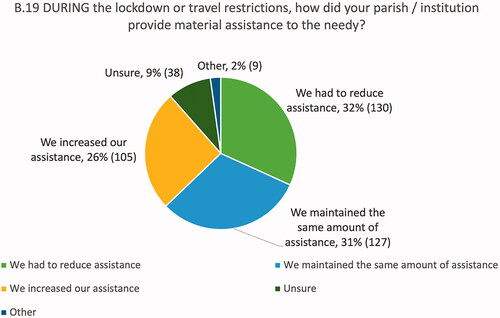
Graph 17. Aid from the parish to the needy during the first months of the pandemic (437/443, 99%).