Figures & data
Table 1. Criteria used for the selection of the units of analysis.
Table 2. Categories related to engagement.
Table 3. Categories and variables for the analysis of tweets published from 27 to 28 March 2020.
Table 4. User characteristics.
Table 5. Twitter impact characteristics.
Figure 1. Distribution of users and tweets published in Spanish between March and December 2020. The graph reflects the interest of Twitter users in the tweets published on the activities of Pope Francis. Source: data processed with Tweet Binder.
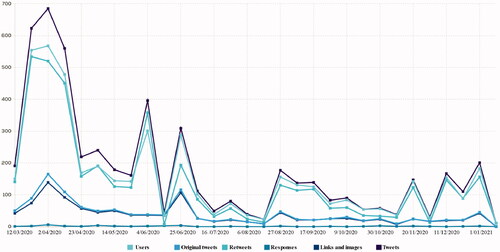
Figure 2. Distribution of users and tweets published in English between March and December 2020. The graph reflects the interest of Twitter users in the tweets published about Pope Francis’s activities. Source: data processed with Tweet Binder.
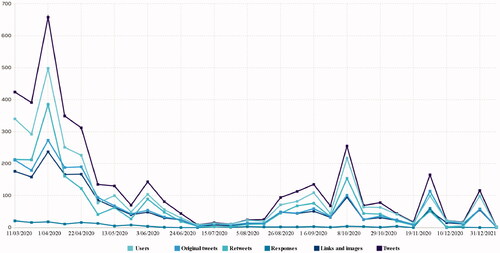
Table 6. General characteristics of users and tweets related to the study.
Table 7. Distribution of categories according to sentiment.
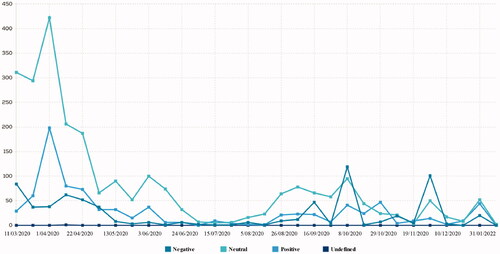
Figure 3. Distribution of users and sentiment analysis in tweets published in Spanish between March and December 2020. “Neutral” tweets become more frequent. In the first weeks, once the pandemic has been declared, tweets with “positive” sentiment are more relevant, coinciding with the event in St. Peter's Square. Source: data processed with Tweet Binder.
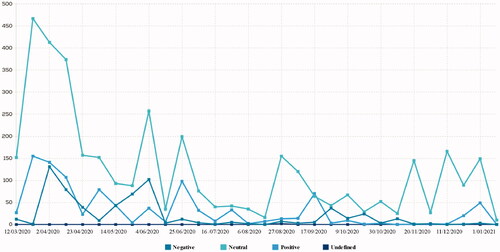
Figure 4. Distribution of users and sentiment analysis in tweets published in English between March and December 2020. A similar trend is maintained with respect to tweets published in Spanish (see ). “Neutral” tweets become more frequent. In the first weeks, once the pandemic has been declared, tweets with “positive” sentiment are more relevant, coinciding with the event in St. Peter's Square. Source: data processed with Tweet Binder.