
Figures & data
Figure 1. Map of 31 May 1985 Tornadoes that impacted the state of Pennsylvania.
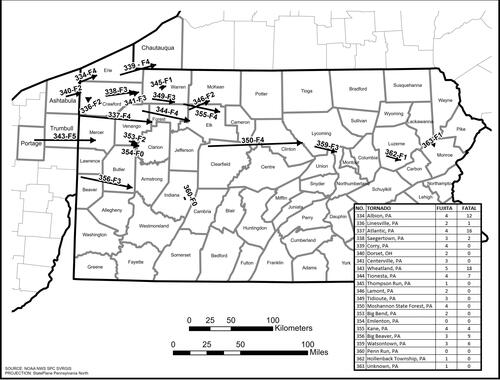
Table 1. Summary of all tornadoes that impacted Pennsylvania on May 31, 1985. “FATAL” represents the number of fatalities.
Figure 2. Portion of 359-Watsontown tornado overlaid and intersecting: A. land cover data B. buildings data C. census blocks groups and D. urban land cover (grey) within each census block group..
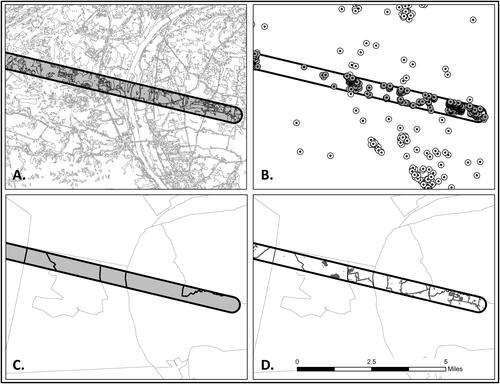
Figure 3. Synopsis of Data and Methods.
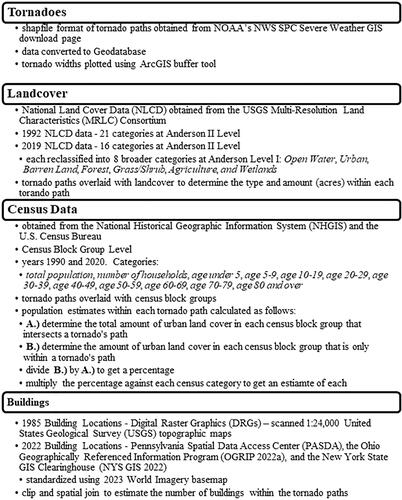
Table 2. Total amount (acres) and type of 1992 Anderson Level I land cover within each tornado path.
Table 3. Demographic characteristics of the 1985 population within each tornado path.
Table 4. Number of buildings within each tornado path for the 1985 and 2023 (present-day) time periods.
Table 5. Total amount (acres) and type of 2019 Anderson Level I land cover within each tornado path.
Table 6. Table 6. Absolute (acres) and percentage change in land cover within each tornado path from 1992 to 2019.
Table 7. Demographic characteristics of the 2020 population within each tornado path.
Table 8. Absolute and percent change in the population from 1990 to 2020 within each tornado path.
Table 9. Correlation coefficients and P-values. Model has a R2 value of 0.94 and adjusted R2 of 0.91.
Table 10. Estimation of tornado fatalities for 1985 and 2020 using Fujita regression equations.
Data availability statement
Data analyzed in this study were obtained from a variety of sources. Some are a re-analysis of existing data and others were created by the author (available upon request). All are openly available at locations cited throughout the Data and Methods section and subsequently in the Reference section.