Figures & data
Figure 1. Maximum-likelihood phylogram for Platyrrhinus species. Support statistics from the ML and Bayesian analyses are indicated at each resolved node: Bayesian posterior probabilities/ML bootstrap frequencies (values greater that 50% are presented).
Table 1. Pairwise uncorrected (%) divergences (mean ± standard deviation) in Cyt-b sequences among six Platyrrhinus species.
Table 2. Factor loadings for the first three factors extracted from the correlation matrix in a Principal Component Analysis (PCA) of 22 measurements comparing Platyrrhinus umbratus and P. nigellus.
Figure 2. Plot of scores on the first and second axes of the Principal Component Analysis (PCA) of 22 measurements of Platyrrhinus umbratus (n = 42) and P. nigellus (n = 56). A) individuals according to by species. B) Individuals according to sex.
Table 3. Evaluation metrics of ecological niche models generated for the broad-nosed bats, Platyrrhinus umbratus and P. nigellus, in northern South America. FC, feature classes; RM, regularization multiplier; AUCTEST, threshold-independent metric based on predicted values for the test localities; OR10, threshold-dependent metric indicating the proportion of test localities with suitability values lower than that excluding the 10% of training localities with the lowest predicted suitability; p, number of parameters in the model; EXVAR, variables excluded from the final model.
Figure 3. Estimation of current potential distributions for broad-nosed bats in northern South America. Maxent models based on: A) Platyrrhinus nigellus occurrences; B) P. umbratus occurrences; C) P. nigellus + P. umbratus occurrences. Increasingly warm colors indicate higher suitability values across the study area. Histograms, showing elevation range and pixel frequency of predicted potential distributions, are inserted in the maps.
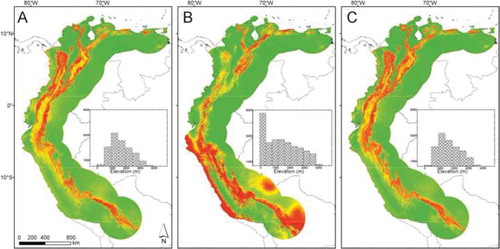
Table 4. External and cranial measurements (mm) of Platyrrhinus umbratus. Values stand for: mean (minimum–maximum) sample size.
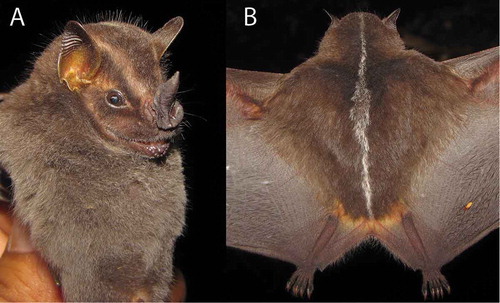
Figure 4. Platyrrhinus umbratus specimen from Urusayhua, Province of La Convención, Department of Cuzco, Peru. A) head and body; B) dorsal view of body. Photos: Alexander Pari Chipana.