
Figures & data
Figure 1. Lucilia sericata (Calliphoridae) from Quito, Ecuador. Photo by Felipe Varela
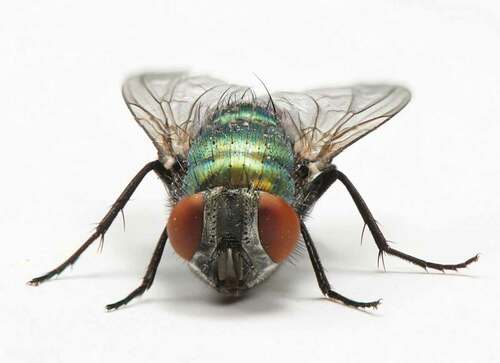
Figure 2. Map showing localities for all Lucilia species in Ecuador
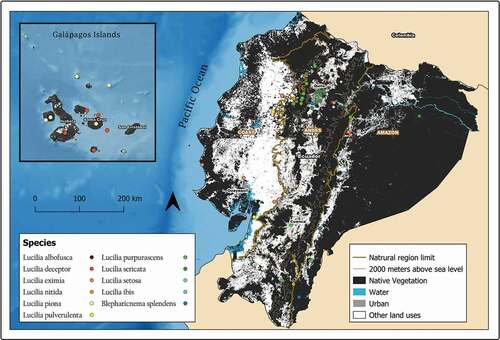
Figure 3. Map showing localities for the distribution of Lucilia albofusca, L. eximia, and L. pulverulenta in continental Ecuador
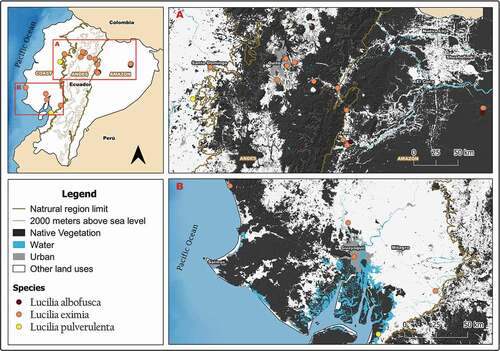
Figure 4. Map showing localities for the distribution of Lucilia purpurascens and L. nitida in continental Ecuador
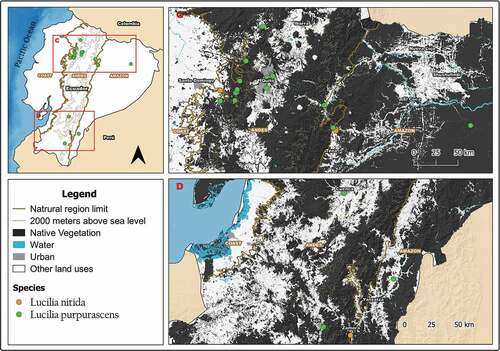
Figure 5. Map showing localities for the distribution of Lucilia ibis, L. sericata and Blepharicnema splendens in continental Ecuador
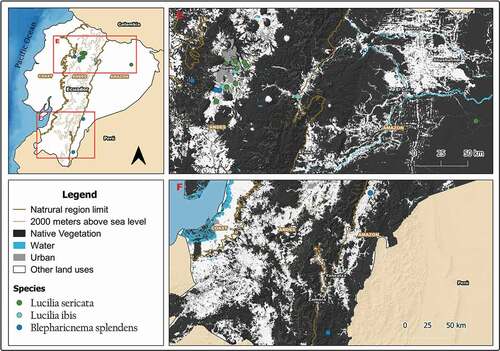
Figure 6. Map showing localities for the distribution of Lucilia deceptor, L. piona and L. setosa in the Galapagos Archipelago, Ecuador
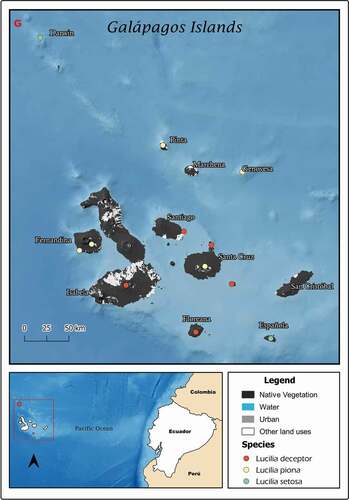
Table 1. Checklist of green bottle flies (Calliphoridae: Luciliinae) of Ecuador. Abbreviations; PAC: Pacific coast; AND: Andean region; AMA: Amazonia; GAL: Galapagos Insular region. Imb: Imbabura; Mor: Morona Santiago; Zam: Zamora; Orell: Orellana; Pichin: Pichincha; Esp: Española; Isab: Isabela; Barto: Bartolome; Flore: Floreana; Sey: Seymour; Sto. Dom: Santo Domingo; Guay: Guayas; Sta. Ele: Santa Elena; Fernan: Fernandina; Geno: Genovesa; Coto: Cotopaxi; Azu: Azuay
Figure 7. Evolutionary analysis by Maximum Likelihood method of Lucilia barcodes in Ecuador. The evolutionary history was inferred by using the Maximum Likelihood method and Kimura 2-parameter model [Citation43]. The tree with the highest log likelihood (−1517.85) is shown. The percentage of trees in which the associated taxa clustered together is shown next to the branches. Initial tree(s) for the heuristic search were obtained automatically by applying Neighbor-Join and BioNJ algorithms to a matrix of pairwise distances estimated using the Maximum Composite Likelihood (MCL) approach, and then selecting the topology with superior log likelihood value. A discrete Gamma distribution was used to model evolutionary rate differences among sites (5 categories (+G, parameter = 0.4209)). The rate variation model allowed for some sites to be evolutionarily invariable ([+I], 76.10% sites). The tree is drawn to scale, with branch lengths measured in the number of substitutions per site. This analysis involved 55 nucleotide sequences. Codon positions included were 1st+2nd+3rd+Noncoding. There were a total of 654 positions in the final dataset. Evolutionary analyses were conducted in MEGA X (Citation44–45)
![Figure 7. Evolutionary analysis by Maximum Likelihood method of Lucilia barcodes in Ecuador. The evolutionary history was inferred by using the Maximum Likelihood method and Kimura 2-parameter model [Citation43]. The tree with the highest log likelihood (−1517.85) is shown. The percentage of trees in which the associated taxa clustered together is shown next to the branches. Initial tree(s) for the heuristic search were obtained automatically by applying Neighbor-Join and BioNJ algorithms to a matrix of pairwise distances estimated using the Maximum Composite Likelihood (MCL) approach, and then selecting the topology with superior log likelihood value. A discrete Gamma distribution was used to model evolutionary rate differences among sites (5 categories (+G, parameter = 0.4209)). The rate variation model allowed for some sites to be evolutionarily invariable ([+I], 76.10% sites). The tree is drawn to scale, with branch lengths measured in the number of substitutions per site. This analysis involved 55 nucleotide sequences. Codon positions included were 1st+2nd+3rd+Noncoding. There were a total of 654 positions in the final dataset. Evolutionary analyses were conducted in MEGA X (Citation44–45)](/cms/asset/9faae65d-faf4-41a9-a895-89e22e86b400/tneo_a_1804747_f0007_b.gif)
Table 2. Barcode index numbers (BINs) associated to Ecuadorian Lucilia, and their distribution across the world